
Key Takeaways
Contents
JustWolves is an educational platform and is not a SEBI-registered investment advisor. Trading financial instruments involves significant risk of loss and may not be suitable for all investors. Past performance is not indicative of future results. Read our full disclaimer →
❝Every time the market appears to be continuing in one direction and then violently reverses, a Change in State of Delivery has occurred. Learning to identify this pattern — and the four conditions that make it high-probability — puts you on the right side of these reversals instead of being trapped by them.
What Is a Change in State of Delivery?
A Change in State of Delivery (CISD) is a reversal pattern in which price momentum shifts direction suddenly and decisively. In a bullish market, this means price transitions from a buy-side delivery — a sequence of candles pushing higher — to a bearish state, confirmed when price closes below the opening of the first candle in that upward sequence. In a bearish market, the reverse applies: price shifts from a sell-side delivery to a bullish state when it closes above the opening of the first candle in the downward sequence.
The name describes exactly what is happening at the structural level: the "state" of how price is being delivered to the market changes. When the market is in a buy-side delivery, price is being offered to buyers — pushed higher with institutional momentum. When that delivery state changes, the institutions that were delivering price upward have now stepped back (or reversed), and the market begins delivering price to a new destination in the opposite direction.
This pattern is particularly powerful as a reversal signal because it captures the momentum shift at its origin — at the opening candle of the delivery that is being reversed — rather than waiting for a full structural break. It gives traders an early entry into major reversals, often with a tight, well-defined risk level.
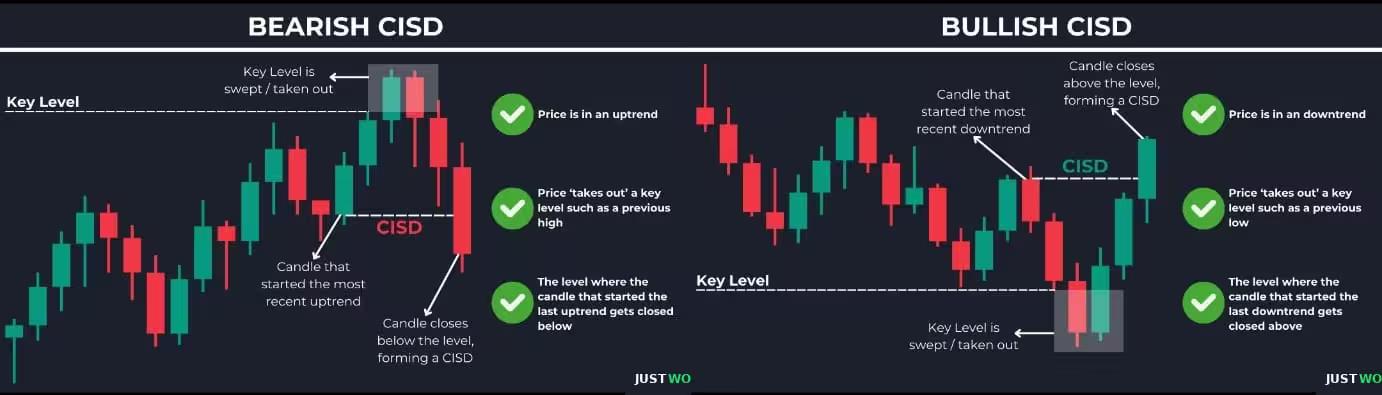
"CISD is not a lagging confirmation of a reversal — it is the moment the reversal begins. The candle that closes below the buy-side delivery origin is the precise instant institutional order flow switches direction.
The Origin Point — The Anchor of CISD
The origin point is the single most important level in any CISD analysis. It is defined as the opening price of the first candle in the most recent directional delivery — the first candle in the sequence of up-close candles that formed the buy-side delivery (for a bearish CISD), or the first candle in the sequence of down-close candles that formed the sell-side delivery (for a bullish CISD).
When there are multiple candles in the delivery sequence (as is common in trending markets), always use the opening price of the first candle in the series — not the most recent candle, and not the series high or low. This is the institutional starting point of the delivery, and it is the level that, once broken, confirms the state has changed.
After the CISD is confirmed by a close beyond the origin point, that origin level flips its role. In a bearish CISD, the origin (previously support) becomes resistance. In a bullish CISD, the origin (previously resistance) becomes support. This flip is the foundation of the CISD trade entry: when price pulls back to the origin level on a retest, the flipped level provides the entry zone with the trend now confirmed in the opposite direction.
How to Identify the CISD Origin Point
── BEARISH CISD (Buy-Side Delivery Reversal) ────────────────────────
Step 1: Identify the most recent bullish impulse (buy-side delivery)
Step 2: Locate the FIRST candle in the series of up-close candles
Step 3: Mark its OPENING PRICE as the origin point
Trigger: A candle closes BELOW this opening price → CISD confirmed
Entry: Wait for price to pull back to the origin → enter short
── BULLISH CISD (Sell-Side Delivery Reversal) ───────────────────────
Step 1: Identify the most recent bearish impulse (sell-side delivery)
Step 2: Locate the FIRST candle in the series of down-close candles
Step 3: Mark its OPENING PRICE as the origin point
Trigger: A candle closes ABOVE this opening price → CISD confirmed
Entry: Wait for price to pull back to the origin → enter long
CISD vs Change of Character — Key Differences
The Change of Character (CHoCH) and the Change in State of Delivery (CISD) both signal a potential reversal, but they operate at different points in the reversal sequence and serve different purposes in your trading.
A Change of Character is a structural signal — it occurs when price breaks through a well-defined, previously respected market structure level (a significant swing high in a downtrend, or a significant swing low in an uptrend). CHoCH confirms that the larger market structure has shifted. This is a relatively late-stage reversal signal because it only fires after price has already moved enough to break the main structure — which means the initial part of the reversal has already occurred before the entry is available.
A CISD is a momentum signal — it fires the moment the delivery state changes at the origin candle. This happens earlier in the reversal sequence, often before the larger structural break has formed. The advantage is a tighter stop, a better entry price, and a larger potential reward. The disadvantage is that without the additional rules (HTF level, liquidity sweep, volume confirmation), CISD setups can produce false signals in the middle of trend continuations.
The practical relationship: when a CISD occurs at a valid HTF level and is followed by a CHoCH, the combined signal is extremely high confidence. The CISD provides the early entry; the CHoCH provides confirmation. If you miss the CISD entry, the subsequent CHoCH gives you a second, more confirmed entry at the cost of a wider stop.
CISD vs CHoCH — At a Glance
CISD
Early momentum signal — fires at origin candle close. Tighter stop, better R:R, requires HTF context to filter false signals.
CHoCH
Structural confirmation — fires after main level breaks. More confirmations, wider stop, lower R:R but higher single-signal reliability.
Rule 1: Rejection of a Higher Timeframe Key Level
The single most important filter for CISD setups is the presence of a higher timeframe key level or PD array. A CISD that forms in the middle of an open chart with no structural context has a low probability of producing a sustained reversal. A CISD that forms after price has tapped into a 4-hour, daily, or weekly demand zone, supply zone, Fair Value Gap, or Order Block has a dramatically higher probability of producing a significant move.
Higher timeframe key levels have the power to influence price movement across lower timeframes because they represent areas where institutional orders are waiting to be activated at scale. When price reaches these zones, the institutions behind them begin executing — and that execution creates the CISD on the lower timeframe.
Practical application: before looking for CISD setups on the 15-minute or 1-hour chart, always zoom out to the 4-hour and daily chart first. Identify the nearest key level in the direction of your intended trade. If price is approaching a 4H supply zone and you are looking for a bearish CISD, the setup is structurally valid. If price is in the middle of a range with no clear HTF context, wait for a more favorable location.
No HTF Level = No CISD Trade
Without a higher timeframe key level, CISD is just a momentum shift that could reverse again within a few candles. The HTF level is what gives the CISD structural backing — it is the reason institutions are executing at that precise price, which is what creates the momentum shift you are observing as the CISD.
Rule 2: Sweeping a Liquidity Pool
A high-quality CISD setup almost always occurs after the market has swept a liquidity pool — a cluster of stop-loss orders positioned at obvious levels such as equal highs, equal lows, previous session highs or lows, or psychological round numbers.
The sequence is critical: price first sweeps the liquidity pool (triggering the stop-losses clustered there), then immediately shifts delivery state in the opposite direction. This two-part move — sweep then reverse — is the institutional signature. The sweep provides the institutions with the opposing orders they need to fill their large position; the reversal is the result of the institutional position now being established and driving price away.
When you observe this pattern — a sharp move into a known liquidity cluster followed by an immediate CISD — you can be confident that the reversal is institutional rather than retail-driven noise. Retail reversals are hesitant, with multiple attempts and wicks; institutional reversals post-sweep are sharp, clean, and sustained because the institution has already acquired the full position size and has no need for further price manipulation at that level.
Rule 3: Volume and FVG Confirmation
Volume confirmation for a CISD is most reliably identified through the formation of a Fair Value Gap (FVG) during the momentum shift. In markets without a visible volume indicator, the FVG serves as a proxy for institutional volume — it shows that price moved so aggressively that it left an imbalance in the order book, which only happens when large market orders (institutional) are being executed.
When the CISD candle — the candle that closes below the origin point in a bearish CISD, or above the origin in a bullish CISD — leaves behind a Fair Value Gap, it confirms that institutional participation was behind the momentum shift. A CISD with a corresponding FVG is significantly more reliable than one with no FVG, because the FVG is direct evidence of the institutional order flow that caused the delivery state change.
Additionally, when price later retraces into the FVG formed during the CISD, that FVG becomes a secondary entry zone — an opportunity to join the reversal if you missed the initial pullback to the origin point. The FVG fill and the origin retest often occur in sequence, giving you two entry windows for the same trade.
Rule 4: Wait for the Pullback Retest
The fourth rule is the discipline element — and the one most traders struggle with. After a CISD is confirmed (the candle closes beyond the origin point), price often continues immediately in the new direction before pulling back. The correct approach is to wait for that pullback — for price to return to the origin level — before entering.
Entering on the CISD candle itself (or the next candle after it) produces entries with excessive risk because the stop-loss must be placed far from the entry to account for potential retracement. Waiting for the pullback to the origin allows you to enter precisely at the level that has flipped (support to resistance, or resistance to support), with a stop just beyond the opposite side of the origin candle, producing a significantly tighter stop and a superior risk-to-reward ratio.
The retest of the origin level also provides implicit confirmation: if price returns to the origin and fails to reclaim it — producing a rejection candle, a wick, or a lower timeframe structural failure — it confirms that the CISD is valid and the level has successfully flipped. If price reclaims the origin level on the retest and closes beyond it, the CISD is invalidated and you should step aside rather than force the trade.
How to Enter a CISD Trade
The Complete CISD Entry Process
- 1
Step 1 — Identify the HTF Key Level
Zoom to the 4-hour or daily chart. Find the nearest relevant PD array in the direction of your intended trade: a supply zone (for bearish), demand zone (for bullish), a daily Fair Value Gap, or a significant order block. This is the structural backdrop your CISD must form at.
💡 If the HTF level is a clean, untouched zone with a clear origin (first touch, not multiple retests), the CISD forming there will be higher quality than one at an already-retested level.
- 2
Step 2 — Mark the Delivery Series and Origin Point
On the lower timeframe (15-minute or 1-hour), identify the most recent directional delivery — the series of up-close or down-close candles that represents the current momentum. Mark the opening price of the FIRST candle in this series as the origin point. Draw a horizontal line at this level.
💡 If there is only one candle in the series, use its opening price. If there are five candles in the series, still use only the opening of the first one.
- 3
Step 3 — Wait for the CISD Trigger
Monitor for a candle that closes beyond the origin point in the opposite direction. In a bearish CISD, wait for a candle to close below the origin. In a bullish CISD, wait for a candle to close above the origin. This is the confirmation that the delivery state has changed. Note whether the trigger candle leaves a Fair Value Gap — if it does, the CISD is volume-confirmed.
💡 Do not enter at the close of the CISD candle. The entry comes on the retest — not the trigger.
- 4
Step 4 — Wait for the Pullback to the Origin
After the CISD is triggered, monitor for price to pull back to the origin level. In a bearish CISD, price will retrace upward toward the origin (now resistance). In a bullish CISD, price will retrace downward toward the origin (now support). Set a price alert at the origin level so you are ready for the entry when it approaches.
💡 If price pulls back all the way through the origin and reclaims it by closing on the other side, the CISD is invalidated. Do not enter in this case — the delivery state has reverted.
- 5
Step 5 — Enter, Stop and Target
When price returns to the origin and shows a reaction — a rejection candle, a wick, or a lower timeframe CHoCH at the origin level — enter in the CISD direction. Place your stop just beyond the extreme of the CISD candle (or the HTF key level boundary). Target the nearest HTF structural level, previous session low/high, or next imbalance in the trade direction.
💡 A minimum 2:1 risk-to-reward is the baseline for CISD entries. If the distance from origin to target does not provide at least 2:1, project a standard deviation extension from the manipulation section to find a more distant target.
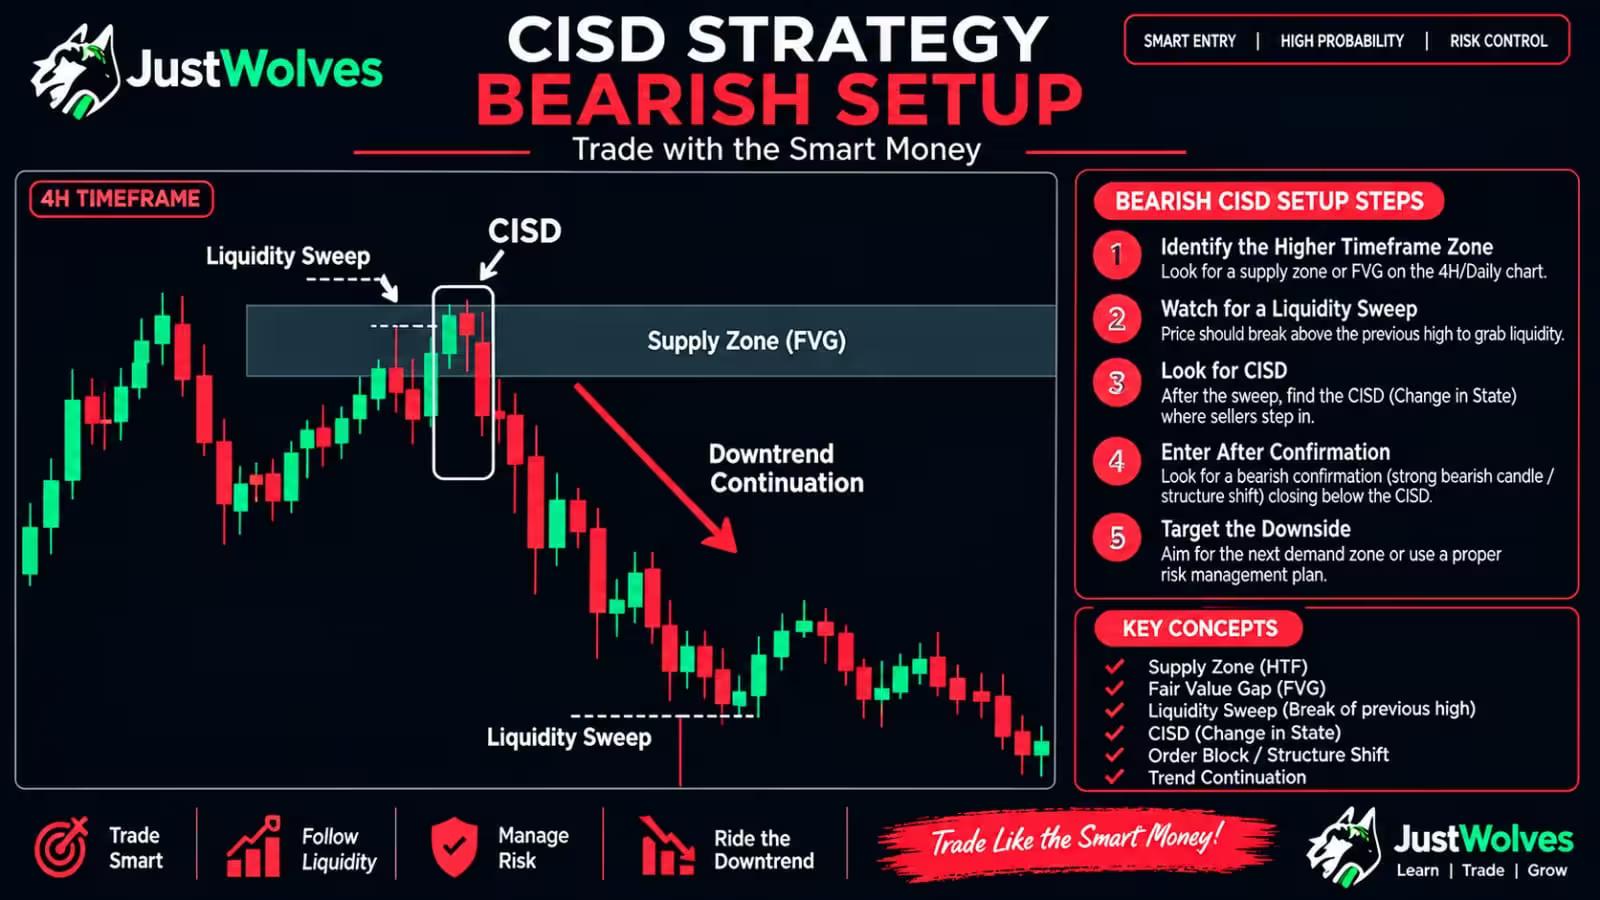
Bearish CISD Example — EUR/USD 15-Minute
On the EUR/USD 15-minute chart, a clear bearish structure is visible — price has recently broken below a key level that had acted as support multiple times. A strong bearish impulse candle with a Fair Value Gap formed during the break, suggesting sellers are in control.
From a price action standpoint, if price pulls back to the former support (now resistance), a rejection is expected and a short entry is logical. However, instead of rejecting, price produces a strong bullish move with its own FVG that breaks back above the resistance area. This sudden momentum shift — bullish candles breaking above a level that was bearish-confirmed — is the CISD signal.
In this case, the CISD reveals that the bearish breakout was a fake-out designed to target liquidity resting below the equal lows beneath the support level. With sell-side liquidity collected, the institutional direction is now bullish. The origin point of the last sell-side delivery becomes the key support level for the pullback entry. On the 4-hour chart, price has simultaneously tapped a 4H demand zone — the HTF confluence that validates the CISD setup. The entry is taken at the origin retest with a target at the recent structure high.
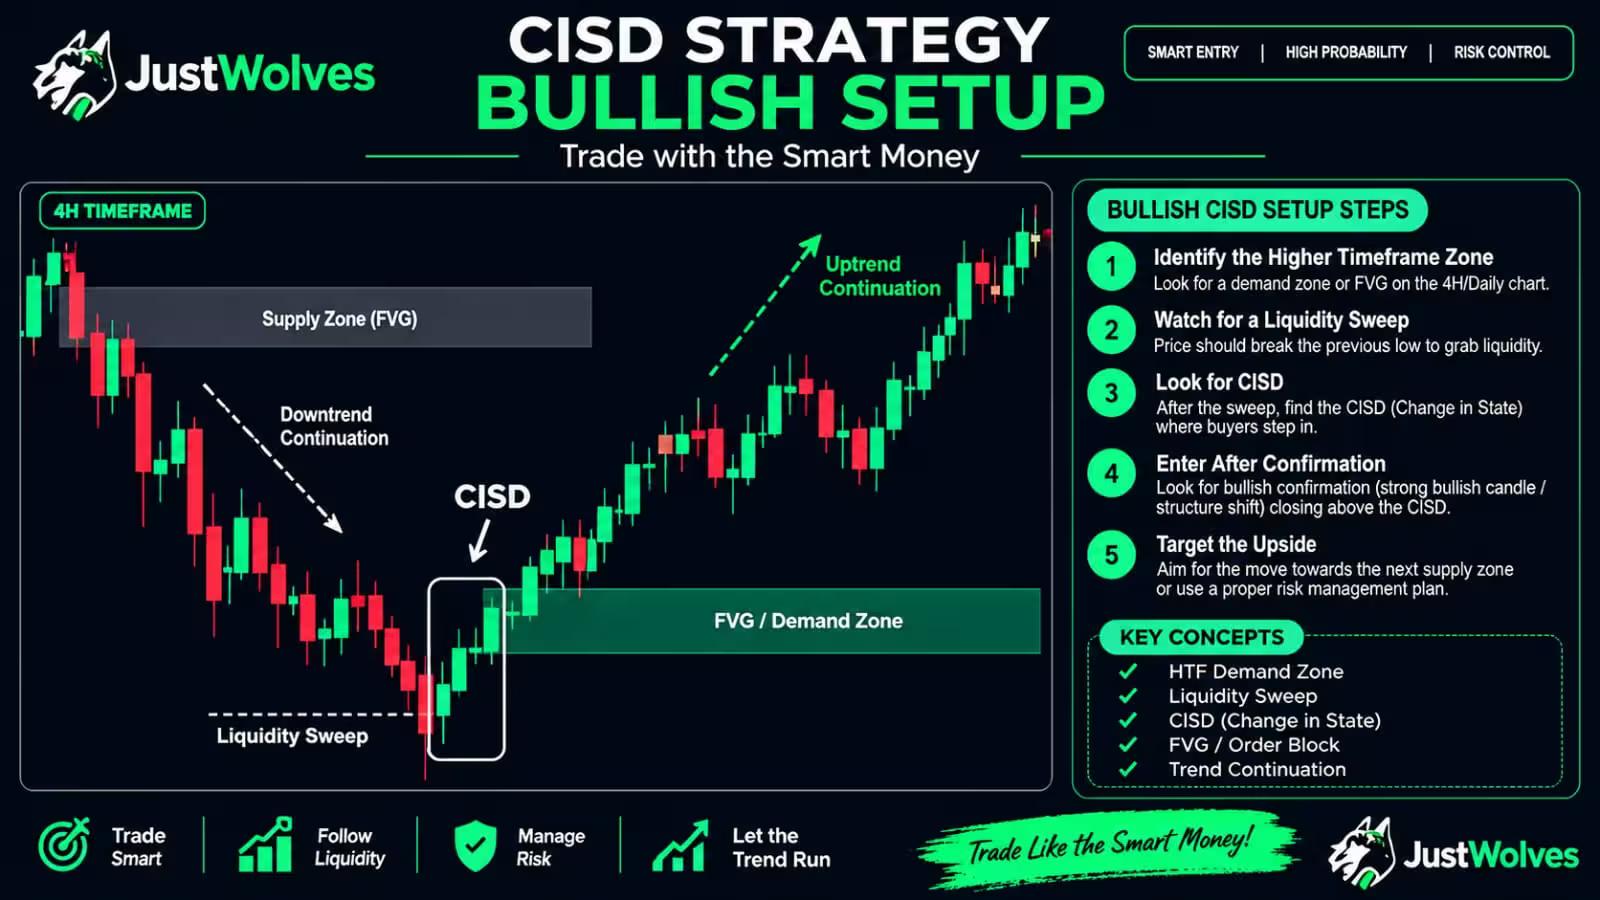
Bullish CISD Example — AUD/USD 15-Minute
On the AUD/USD 15-minute chart, a level has acted as support multiple times. Traders who went long from this area have stop-losses placed just below the support — a visible liquidity pool. Price breaks through the support with a strong bearish momentum candle and a corresponding FVG, appearing to confirm a breakdown.
However, price immediately returns into the support range, forming a bullish FVG on the recovery candle. This complete reversal of the bearish momentum — from below the support level back above it — is the bullish CISD. The bearish breakout was a market-maker-engineered move to sweep the sell-side liquidity below the support. With that liquidity collected, the institution's true intent is to push price higher toward the buy-side liquidity above.
The origin point of the sell-side delivery (the opening of the first bearish candle in the breakdown sequence) becomes the support level for the pullback. The FVG formed during the recovery also provides a secondary entry zone. Both entry points — the origin retest and the FVG fill — offer a long entry with a stop below the sweep low and a target at the recent highs where buy-side liquidity rests.
CISD Trade Checklist
Change in State of Delivery FAQs
Can CISD occur without a liquidity sweep?
Technically yes — a close beyond the origin point can occur without a preceding sweep. However, without the sweep, the setup is significantly lower quality. The liquidity sweep is what provides the institutional backing for the reversal: without it, you may simply be observing a normal corrective candle rather than a delivery state change driven by institutional order flow. If the sweep is absent, require additional HTF confluence and a stronger FVG to compensate before considering an entry.
How many candles can be in the delivery series?
There is no fixed limit — a delivery series can be as few as one candle or as many as ten or more. What matters is that they are all moving in the same direction (all up-close for a buy-side delivery, all down-close for a sell-side delivery). When the series is very long (many candles), the origin point may be far from the CISD trigger level, producing a large gap between the trigger and the entry. In this case, the FVG formed during the CISD often serves as a better entry zone than the distant origin, as it is closer to current price.
What if price does not pull back to the origin after the CISD?
If price gaps or accelerates directly away from the origin without a meaningful pullback, the Fair Value Gap formed during the CISD trigger candle becomes the entry zone. Price typically fills the FVG before continuing in the new direction — set a limit order at the 50% level of the FVG (the Consequent Encroachment) with a stop below/above the FVG boundary. If price does not revisit either the origin or the FVG, the move has already been missed — do not chase it.
How does CISD work differently from a simple breakout trade?
A standard breakout trade enters in the direction of the break and expects continuation. A CISD trade does the opposite — it identifies a fake breakout (the delivery), enters against the direction of the delivery after the origin is violated, and targets a reversal move. The key structural difference: a CISD explicitly requires that the "breakout" (the delivery) is first swept and then violated at the origin point. A breakout trade has no such requirement — it simply follows the initial direction. CISD entries are counter-trend to the delivery but aligned with the true institutional direction.
Is CISD an ICT concept?
The Change in State of Delivery is a concept that appears in ICT (Inner Circle Trader) educational content and has been further developed within the broader SMC trading community. The underlying mechanics — origin point identification, delivery state reversal, order flow shift — are consistent with ICT principles around how institutional order flow is delivered to the market. The 4-rule framework (HTF level, liquidity sweep, FVG volume, pullback retest) is a practical refinement that incorporates SMC risk filters to increase the reliability of the base pattern.
Up Next
Advanced CISD — AMD Framework, Order Block Formation and Standard Deviation Targets