
Key Takeaways
Contents
JustWolves is an educational platform and is not a SEBI-registered investment advisor. Trading financial instruments involves significant risk of loss and may not be suitable for all investors. Past performance is not indicative of future results. Read our full disclaimer →
❝Break of Structure and Change of Character are the two most fundamental concepts in Smart Money Concept trading. Master these and you will always know whether a trend is continuing or reversing — before most retail traders even notice.
The Three Market Structures
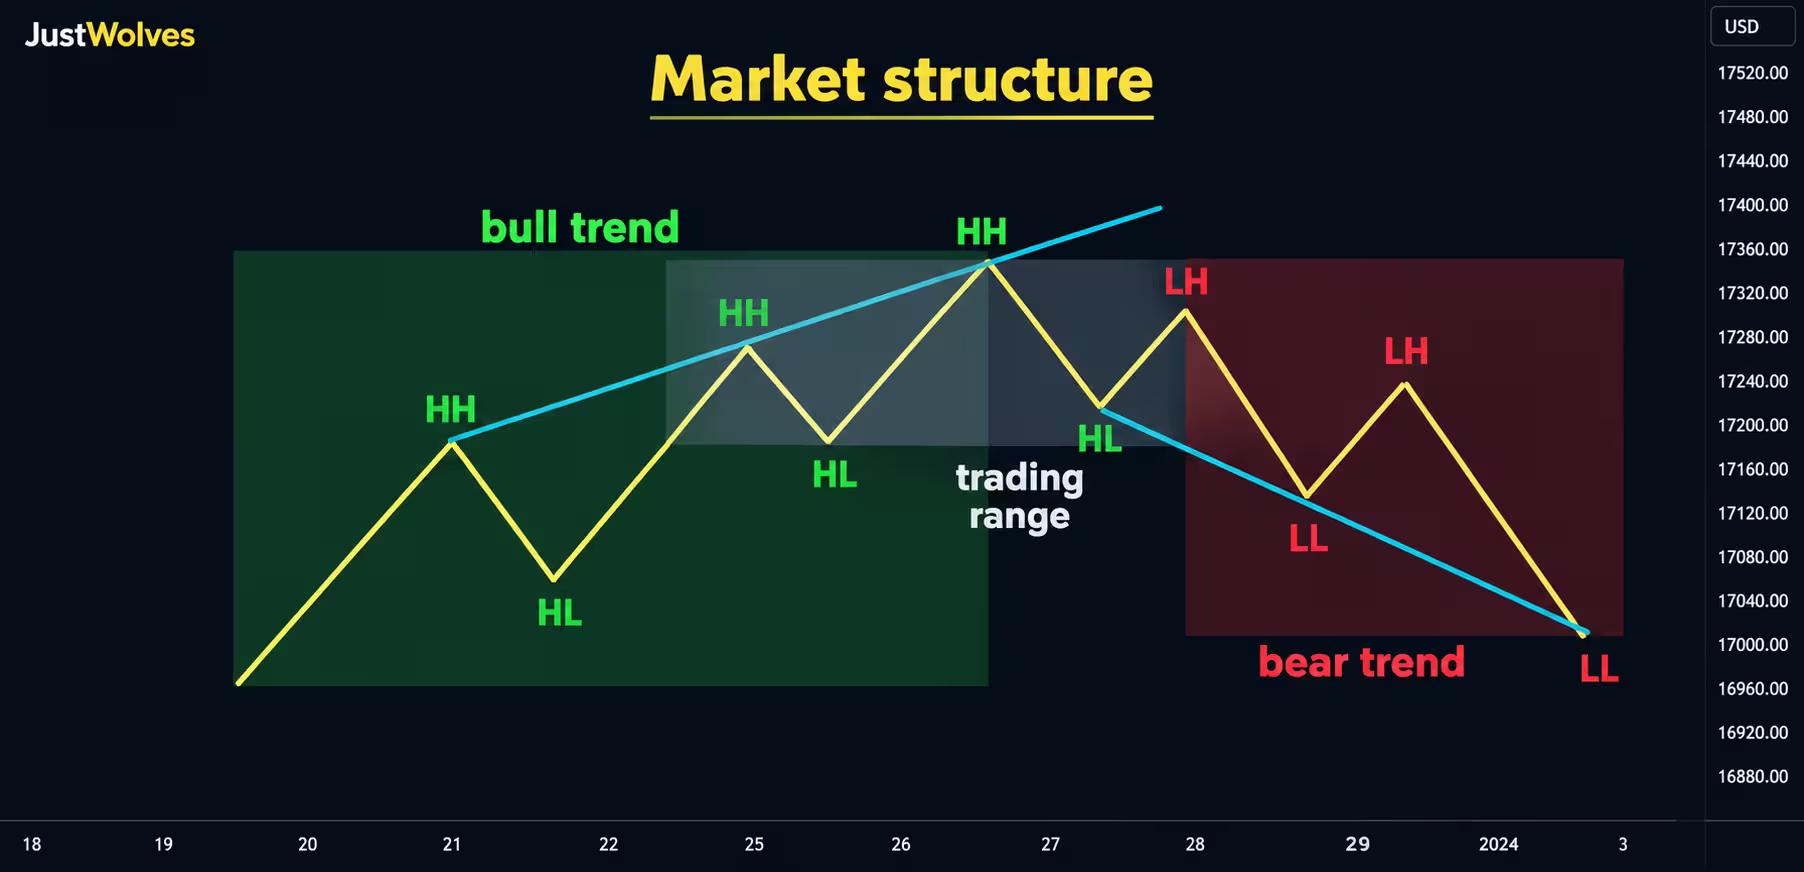
Every market — forex, indices, stocks, crypto — exists in one of three structural states at any given moment. Understanding which state you are in is the foundation of all Smart Money Concept analysis.
A bullish structure is defined by a sequence of higher highs (HH) and higher lows (HL). Each time price makes a new peak above the previous peak, and each trough is higher than the last, the market is in a confirmed uptrend. Buyers are progressively in control.
A bearish structure is the mirror: lower highs (LH) and lower lows (LL). Each peak fails to reach the previous peak, and each trough falls below the last. Sellers are in control and are applying consistent downward pressure.
A sideways structure (consolidation) shows no clear directional bias — highs and lows are roughly equal on both sides. Price oscillates within a range, neither buyers nor sellers able to take lasting control. Consolidations are distribution or accumulation phases and often precede explosive directional moves.
The Three Market States
HH + HL
Bullish structure pattern
LH + LL
Bearish structure pattern
≈ Equal
Sideways / range structure
External vs Internal Highs and Lows
One of the most critical distinctions in SMC market structure mapping — and one of the most misunderstood by beginners — is the difference between external and internal highs and lows.
External highs and lows are the significant swing points on the timeframe you are analysing. If you are looking at the 1-hour chart, external highs and lows are the ones that appear on the 1-hour chart — the peaks and troughs that define the overall structure.
Internal highs and lows are the smaller swings that form within the trend on lower timeframes. On a 1-hour uptrend, the internal structure might include dozens of tiny highs and lows visible on a 5-minute or 1-minute chart. These internal movements are how price travels from one external structure point to the next.
The rule is simple: structure mapping uses only external highs and lows. When you ask "is this a Break of Structure?" or "is this a Change of Character?", you are asking about external swing points — not the internal noise that forms within the move. Trying to map structure using internal swings produces false signals on almost every timeframe.
How to Spot the Difference
A practical test: if you are on the 1-hour chart, zoom in to the 5-minute chart and look at all the small highs and lows within a single 1-hour candle move. Those are all internal. None of them should shift your swing high or swing low on the 1-hour structure map. Only the external 1-hour highs and lows do that.
Break of Structure (BOS) — Defined
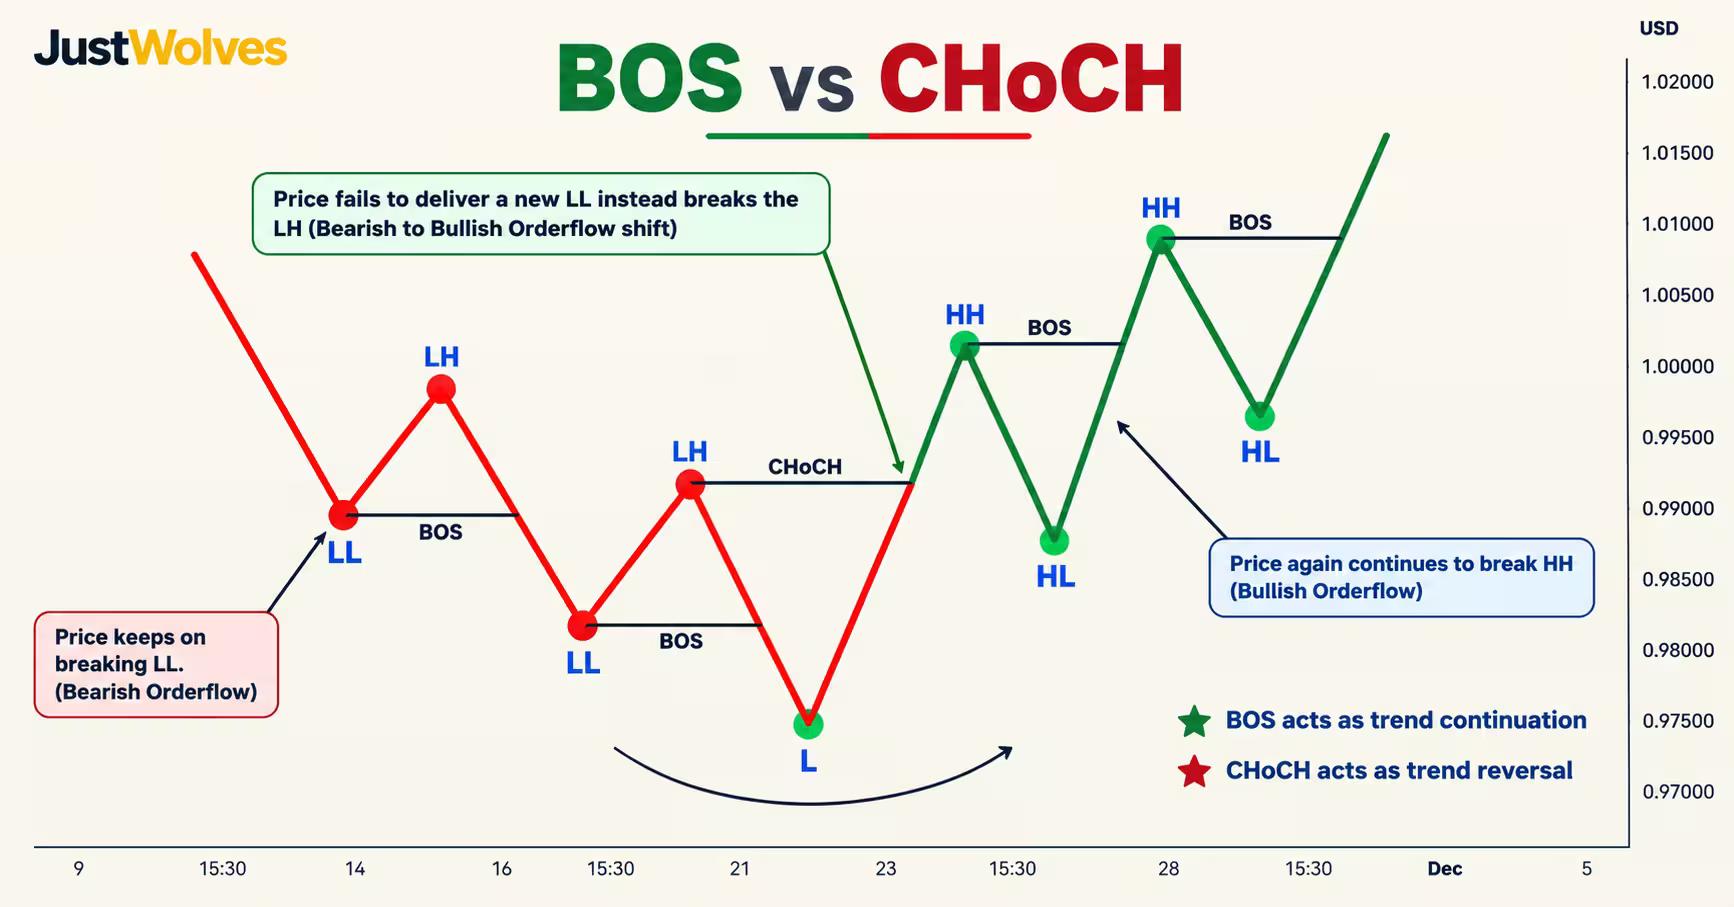
A Break of Structure (BOS) is the SMC term for trend continuation. This naming surprises many beginners — "break" sounds like a reversal — but in SMC, BOS means price has broken through a previous swing high (in an uptrend) or swing low (in a downtrend), confirming that the trend is still intact and moving forward.
In a bullish market, a BOS occurs when price breaks and closes above the previous external swing high. This tells you: buyers are still in control, the uptrend is continuing, and this is not the time to look for short trades. After a valid bullish BOS, you shift your tracked swing low forward to the most recent pullback low — because this is now the level buyers must defend.
In a bearish market, a BOS occurs when price breaks and closes below the previous external swing low. Sellers are in control, the downtrend is continuing. You shift your tracked swing high forward to the most recent bounce high — the level sellers must defend.
Think of BOS as a confirmation tick mark: each BOS confirms the trend is progressing normally. You should be looking for trades in the trend direction, not against it.
"A Break of Structure is not a break of the trend — it is proof the trend is alive. The market broke through a prior high to confirm buyers are still winning.
Valid vs Invalid BOS — The 50% Pullback Rule
Not every new high or low qualifies as a valid Break of Structure. Two conditions must both be met before you shift your swing points forward and treat the BOS as confirmed.
Condition 1 — Candle close: the candle must CLOSE above the swing high (for a bullish BOS) or below the swing low (for a bearish BOS). A wick that momentarily exceeds the level, then closes back below it, is not a BOS — it is a liquidity sweep. The close is everything.
Condition 2 — Valid pullback: after the initial move that created the BOS, price must pull back at least 50% of the swing range before the next leg up. Use the Fibonacci retracement tool from the swing low to the swing high. A valid pullback reverses around the 0.50 or 0.618 level — these are called deep pullbacks. A pullback that only retraces to the 0.382 level or shallower is a shallow pullback and does not qualify.
Valid vs Invalid BOS — Quick Reference
── VALID BREAK OF STRUCTURE ─────────────────────────────────────────
✓ Candle CLOSES above the swing high (not just a wick)
✓ Subsequent pullback retraces 50–61.8% of the range (deep pullback)
✓ Swing low is shifted forward to the new pullback low
✓ Confirms trend continuation — look for pro-trend entries
── INVALID / UNCONFIRMED BOS ────────────────────────────────────────
✗ Wick exceeds the high but candle closes below it (liquidity sweep)
✗ Pullback only retraces to 0.382 or shallower (shallow pullback)
✗ Do NOT shift your swing low forward
✗ Price may be absorbing stop-losses before reversing
Why does the 50% pullback matter? Because a shallow pullback suggests the move lacked conviction — price did not give buyers (or sellers) a real chance to re-enter at a discounted level. The deep pullback is what institutional participants use to accumulate new positions before the next leg. When you see a deep pullback after a close above the high, you know smart money is loading up again.
The Candle Close Rule
The most common mistake beginners make in structure mapping is treating a wick as a BOS or CHoCH. A wick that temporarily breaks a swing level does not confirm anything — the market is still in price discovery. Only when the candle CLOSES beyond the level is the structural break confirmed.
On the hourly chart, this means waiting for the full one-hour candle to finish forming before calling a BOS or CHoCH. On a 15-minute chart, wait for the 15-minute candle to close. This rule eliminates almost all false structural signals caused by temporary spikes during news releases, session opens, or low-liquidity periods.
A candle that spikes above a swing high and then closes back below it is called a liquidity sweep — price briefly reached the orders sitting above the high (stop losses of sellers, buy-stop orders of breakout traders), collected that liquidity, and then reversed. The close confirms the true intent of the move.
Always Wait for the Candle Close
Set your charting platform to show only closed candles during live trading. Many traders make the mistake of watching forming candles and calling structural breaks before the candle closes. Wait for the candle to finish — those extra seconds of patience save you from countless false entries.
Change of Character (CHoCH) — Defined
A Change of Character (CHoCH) is the SMC term for trend reversal. It signals that the market has stepped out of its current character — bullish or bearish — and is beginning to transition to the opposite one. The term is precise: two characters exist in every market (the bull and the bear), and a CHoCH marks the handover from one to the other.
In a bullish market, a CHoCH occurs when price breaks and closes BELOW the most recent major swing low. This is the first sign that sellers are beginning to take control. Price has not just pulled back — it has broken the last significant low that held during the uptrend. The uptrend structure is now compromised.
In a bearish market, a CHoCH occurs when price breaks and closes ABOVE the most recent major swing high — the first sign that buyers are regaining control. The downtrend structure is compromised.
The key word is "beginning." A CHoCH does not guarantee a full trend reversal. It tells you: the probability of a reversal has meaningfully increased and you should stop looking for pro-trend entries. It is the earliest signal — not the final confirmation. Confirmation comes through the subsequent market structure (lower highs forming in a bullish-to-bearish CHoCH).
BOS vs CHoCH — Side by Side
The confusion between BOS and CHoCH is one of the most common sources of wrong-direction trades in SMC. Understanding the structural context of each signal eliminates this confusion permanently.
BOS vs CHoCH — The Core Distinction
── BREAK OF STRUCTURE (BOS) ─────────────────────────────────────────
What it means: Trend CONTINUATION
In an uptrend: Price closes ABOVE the previous swing HIGH
In a downtrend: Price closes BELOW the previous swing LOW
Action: Continue looking for pro-trend entries
Shift: Move your swing low (uptrend) or swing high (downtrend) forward
── CHANGE OF CHARACTER (CHoCH) ──────────────────────────────────────
What it means: Trend REVERSAL (first signal)
In an uptrend: Price closes BELOW the previous swing LOW
In a downtrend: Price closes ABOVE the previous swing HIGH
Action: Stop looking for pro-trend entries; watch for reversal confirmation
Shift: Do NOT shift swing points — re-evaluate the macro structure
MEMORY AID: BOS = same direction as trend. CHoCH = against the trend.
Strong Lows and the Strongest High
Two specific structural levels become critically important once a CHoCH forms, and both are defined by their relationship to the CHoCH event itself.
The Strong Low is the first swing low that caused the CHoCH — specifically, the swing low that price broke below to create the bearish CHoCH in an uptrend. This low is "strong" because it was the threshold at which the trend structure broke. Going forward, this level will act as major resistance if price rallies back to it. It is the line in the sand: if price cannot reclaim and close above this low, the bearish bias remains intact.
The Strongest High is the swing high formed immediately before the CHoCH — the last peak of the uptrend. This is the most significant resistance level going forward. It concentrates the largest cluster of sellers' stop-loss orders and unfilled sell orders. For bulls to reclaim control of the market, they must close a candle above this level. Until that happens, the assumption is bearish.
Always mark these two levels clearly on your chart after a CHoCH. They become your key reference points for assessing whether the reversal is genuine or whether price is staging a false reversal before resuming the prior trend.
Post-CHoCH Key Levels
Strong Low
First swing low that broke — becomes major resistance
Strongest High
Last swing high before CHoCH — key bull reclaim level
Major Trend vs Counter-Trend
The major trend (also called the pro-trend) is the direction of the external market structure — the sequence of higher highs and higher lows (bullish) or lower highs and lower lows (bearish) that defines the market on your chosen timeframe.
The counter-trend (or minor trend) is the internal movement in the opposite direction of the major trend. In a bullish market, price never moves straight up — it creates a series of rallies and pullbacks. Those pullbacks are the counter-trend moves. They are necessary for the market to generate new liquidity (sellers to take profits, buyers to enter at better prices) before continuing the major trend.
The trap for most retail traders is entering counter-trend moves as if they were trend reversals. You see price pulling back in an uptrend, interpret the short-term downward movement as a new downtrend, and enter short — only to get stopped out when the major trend resumes. This is the most common source of losses for developing traders.
The rule is unambiguous: always identify the major trend first, then only take entries in the direction of that major trend. Counter-trend movements exist to provide you with a better entry price for a pro-trend trade, not to trade against the trend.
Counter-Trend = Entry Setup, Not Trade Direction
When the market is in a major uptrend and pulls back, this pullback is creating your entry opportunity for a long trade — not a shorting opportunity. Wait for the pullback to complete (deep pullback to the 0.50–0.618 zone), then look for a reason to enter long. Fighting the major trend dramatically reduces your win rate regardless of what other confirmations you have.
Timeframe Selection
A frequent question from beginners: which timeframe should I use for structure mapping? The answer depends on your trading style, but a consistent principle applies regardless: choose one timeframe, commit to its external structure, and do not mix signals from different timeframes within the same trade decision.
The 1-hour chart is widely recommended as the best starting timeframe for structure mapping. It provides enough significant swing points to produce reliable structural signals, while being active enough to generate several clear BOS and CHoCH signals each week. The 30-minute chart is a reasonable alternative.
The 4-hour and daily charts are excellent for identifying the broader trend context but produce fewer trading opportunities per week — better suited for swing traders than intraday or scalping traders.
The 5-minute and 1-minute charts contain too much internal noise for reliable standalone structure mapping. Every second candle appears to be a structural break on these timeframes, leading to constant false signals. These timeframes are best used for entry refinement (confirming a precise entry within a structure level identified on a higher timeframe), not for primary structure mapping.
Timeframe Guide for Structure Mapping
── RECOMMENDED ───────────────────────────────────────────────────────
1-Hour chart: Best balance of signals and reliability
30-Min chart: Good alternative, slightly more active
── CONTEXT (not primary mapping) ────────────────────────────────────
4-Hour chart: Use for major trend direction only
Daily chart: Use for macro bias and key weekly levels
── ENTRY REFINEMENT ONLY (not primary mapping) ──────────────────────
15-Min chart: Entry timing within 1H structure zones
5-Min chart: Precise entry on very short scalps only
1-Min chart: Too noisy for structure — entry execution only
SMC Market Structure FAQs
What is the difference between BOS and CHoCH in simple terms?
BOS (Break of Structure) means the trend is continuing — price broke through a swing high (uptrend) or swing low (downtrend) in the direction it was already moving. CHoCH (Change of Character) means the trend may be reversing — price broke through a swing point in the OPPOSITE direction to the current trend. BOS = keep trading with the trend. CHoCH = stop trading with the trend, watch for a reversal.
What makes a pullback "valid" for a Break of Structure?
A valid pullback retraces at least 50% of the swing range, confirmed using the Fibonacci retracement tool (0.50 or 0.618 level). Apply the Fibonacci from the swing low to the swing high. If price reverses around the 0.50 or 0.618 level, that is a deep, valid pullback. If price only retraces to the 0.382 level or barely pulls back at all (shallow pullback), it is not a valid BOS — do not shift your swing low forward.
Can a BOS and a CHoCH happen on the same candle?
No — they are structurally opposite events. A BOS breaks through a level in the trend direction; a CHoCH breaks through a level against the trend direction. On any given timeframe, at any given moment, price is either confirming the trend (BOS territory) or signalling a potential reversal (CHoCH territory). They cannot occur simultaneously at the same structural level.
How many candles must pull back for a valid BOS?
There is no fixed number of candles, but a general guideline used by many SMC traders is at least 3–5 candles in the opposite direction to confirm a genuine pullback. One or two opposing candles may simply be a brief pause, not a real retracement. The Fibonacci depth (50–61.8%) matters more than the candle count — but in practice, a genuine deep pullback usually requires at least 3 candles of meaningful movement.
Is SMC market structure different from traditional technical analysis structure?
The concepts overlap significantly but the terminology and validation rules differ. Traditional technical analysis calls higher highs and higher lows an "uptrend" and lower highs and lower lows a "downtrend" — which is the same as SMC. The key differences are: SMC emphasises the candle close rule strictly (wicks do not count), uses the terms BOS and CHoCH specifically to differentiate continuation from reversal signals, and places emphasis on the relationship between external structure and institutional supply/demand zones. SMC also classifies structural levels as "strong" or "weak" based on their history.
When price forms a CHoCH, should I immediately enter a counter-trend trade?
No. A CHoCH is the first indication that a reversal may be starting — it is not a trade entry signal by itself. After a CHoCH, you watch for confirmation: does price form a lower high (in a bearish CHoCH) and then break another low (bearish BOS)? Only when the new structure begins to establish itself do you consider entering. Jumping in immediately at the CHoCH candle often results in being caught in a fake-out, especially if the CHoCH did not form from a higher timeframe supply or demand zone. (This is covered in depth in the companion topic on valid CHoCH criteria.)
Up Next
Valid Change of Character (CHoCH) in SMC — 3 Criteria for High-Probability Trades