JustWolves is an educational platform and is not a SEBI-registered investment advisor. Trading financial instruments involves significant risk of loss and may not be suitable for all investors. Past performance is not indicative of future results. Read our full disclaimer →
Trend Trading
The EMA Trend Filter
A moving average only reacts to price — it doesn't decide anything. Here's the structure check that tells you when a trend is actually real.
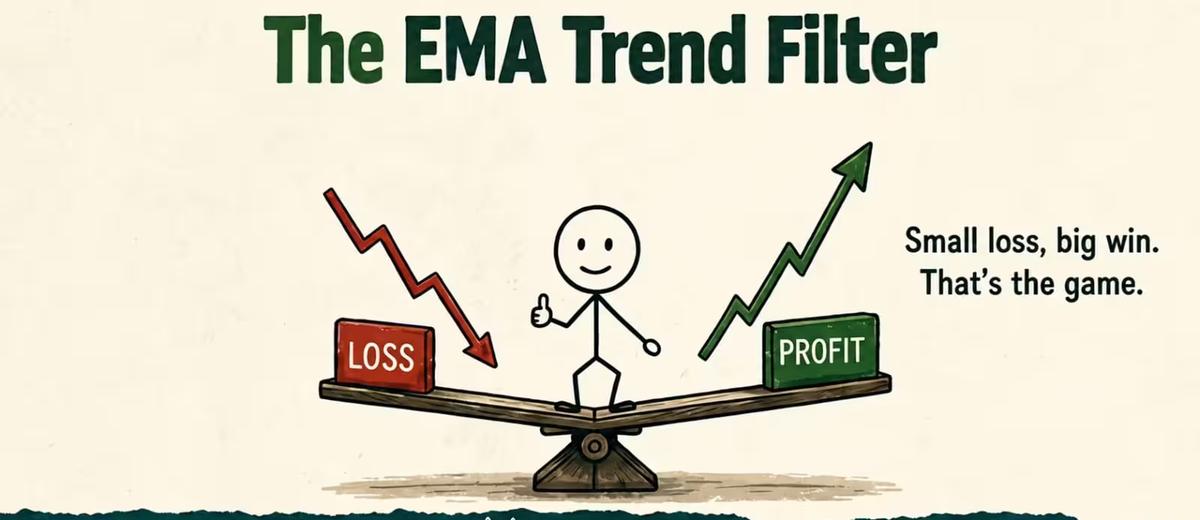
✦ Key Takeaways
- Price sitting above (or below) an EMA is not proof of a trend — the average is just lagging behind recent candles.
- Confirm direction with market structure: a clean run of higher highs and higher lows (or the mirror image for a downtrend) before you trust the slope.
- The '1-2-3' sequence — new high, higher low, higher high (or the reverse) — is the simplest filter for staying out of sideways chop.
- Every market has an EMA period it reacts to most. Test 20, 50, 100 and 200 on your own chart rather than copying someone else's default.
- The strongest entries appear where an EMA touch lines up with a support or resistance zone that has already been tested more than once.
Open ten trading forums and you'll find the same claim repeated with total confidence: price is above the 50 EMA, so the market is trending up. It's one of the first rules new traders memorize, and it's also one of the fastest ways to get chopped up in a range. An exponential moving average is a lagging average of recent closes — nothing more. It doesn't know about support, resistance, or the difference between a genuine breakout and a temporary push into a level that's about to reject.
Why 'above the average' isn't enough
A moving average is a mirror held up to price, not a compass. It shows you where the market has been, smoothed out, and it will always be a few candles behind whatever is happening right now. That lag is exactly why price can sit above the line for a while and still reverse hard — the average simply hasn't caught up yet.
The fix isn't to abandon the EMA. It's to stop treating it as a signal and start treating it as a filter that market structure has to confirm. Structure means the actual shape price is drawing on the chart: the sequence of highs and lows it leaves behind as it moves.
The 1-2-3 structure check
This is the simplest way to separate a real trend from noise sitting near the EMA. In an uptrend you're looking for three moves in order: a push to a new high, a pullback that holds above the prior low (a higher low), and a second push that clears the first high. Flip every part of that for a downtrend.
Confirming an uptrend with structure
Step 1 — A new high forms
Price pushes up and closes above the most recent swing high. On its own this proves nothing — plenty of ranges produce a new high before rolling straight back over.
Step 2 — A higher low holds
Price pulls back but the low of that pullback sits above the previous swing low. If it closes below the last low instead, you're still inside a range, not a trend.
Step 3 — A higher high confirms it
Price pushes again and closes above the high from Step 1. Only now do you have two consecutive higher highs and a higher low between them — the market is trending, not chopping.
The trap most beginners fall into
Jumping in during Step 1, before the higher low and second higher high confirm, is how trend-continuation entries turn into a string of stop-outs. Wait for the full sequence — a slightly later entry into a confirmed trend beats an early entry into a range that never becomes one.
Reading it on a live chart
In practice this looks like price dipping below the 50 EMA, drifting sideways, and testing your patience with small pushes that almost — but not quite — break the last swing point. The moment that changes is when a decisive candle closes clearly through the previous high or low. A weak, indecisive close that barely tags the level doesn't count; you want a candle that leaves no doubt the level has been taken out.
Once structure confirms — say, a lower high followed by a lower low in a downtrend, with price below a downward-sloping EMA — the odds favor continuation over an abrupt reversal. That's the moment to start planning an entry, not the moment the EMA was first crossed.
A faster version: draw the range instead
If counting higher highs and higher lows candle-by-candle feels slow, there's a simpler shortcut. When price touches your EMA, mark the swing high and swing low that formed just before the touch — including any wicks that pierce beyond the candle bodies. That box is your consolidation zone. Nothing inside it is a trend; it's just price ranging around the average.
A trend only starts once price closes outside that box — above the top for a continuation up, below the bottom for a continuation down. It's a slightly less precise read than the full 1-2-3 sequence, but it's fast, visual, and good enough to keep you out of the worst chop.
Turn the EMA into an area of value
Once structure confirms a trend, the EMA earns a second job: it becomes a zone where pullback entries cluster. The highest-quality version of this setup isn't just price touching the average — it's price touching the average at the same spot as an old support or resistance level that's already been tested and flipped more than once.
When both groups of traders — the ones watching the moving average and the ones watching the structure level — are reacting in the same small price zone, the reaction tends to be sharper and more reliable than either signal on its own. That confluence, not the touch itself, is what you're hunting for before entering.
Finding the EMA your market actually respects
How to test EMA periods on your own chart
| Step | What to do | What you're looking for |
|---|---|---|
| 1 | Load the 20 EMA and scroll back through 30–50 past swings | Does price bounce cleanly off it, or slice straight through most of the time? |
| 2 | Repeat with 50, then 75, then 100 | Count clean reactions vs. clean breaks for each period |
| 3 | Repeat with 150 and 200 for the higher-timeframe read | Which period gives the cleanest big-picture trend line? |
| 4 | Compare counts across periods | The period with the most consistent, repeatable reactions is the one this market currently respects |
* Re-run this test whenever you switch instruments or timeframes — the EMA a market respects can change with both.
There's no universal setting. A 50 EMA might be the cleanest trend line on one pair and almost irrelevant on another, where price barely reacts to it but bounces reliably off the 20 or the 200 instead. Treat the EMA period itself as something to test on your specific chart, not a number to copy from a video.
Frequently Asked Questions
Does price above the EMA mean the market is bullish?
Not by itself. It only tells you the average of recent closes is below current price — it says nothing about whether the market is trending or ranging. Confirm with structure (higher highs and higher lows) before treating it as a bullish signal.
Which EMA period should I use — 20, 50, or 200?
Whichever one your specific market actually reacts to. Scroll back through history on your chart and count how often price bounces off each period; use the one with the most consistent reactions rather than a default someone else recommends.
What's the fastest way to avoid trading inside a range?
When price touches your EMA, mark the swing high and low that formed just before the touch. Treat that zone as consolidation and wait for a decisive close outside it before assuming a trend has started.
Why did my trade fail even though price was above the 50 EMA?
Most likely the trend was never confirmed by structure — you were trading inside a range that happened to be sitting above the average, not an actual uptrend.