JustWolves is an educational platform and is not a SEBI-registered investment advisor. Trading financial instruments involves significant risk of loss and may not be suitable for all investors. Past performance is not indicative of future results. Read our full disclaimer →
A Liquidity Trading Strategy in 3 Simple Steps
Price doesn't move randomly. It gets pulled toward liquidity. Once you understand where that liquidity sits, trading becomes a completely different game.
Most traders struggle with liquidity because it's taught in an overcomplicated way. This post breaks it down into three simple steps — with real chart examples showing exactly how it plays out.
Step 1: Identifying Liquidity
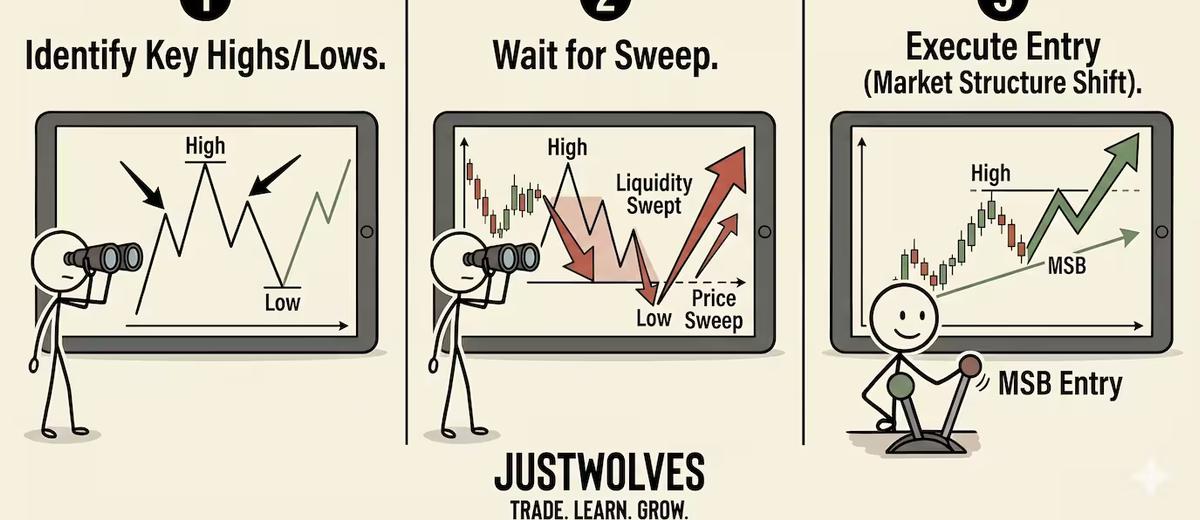
Before you can trade liquidity, you need to know where it lives in the market. Liquidity sits where traders put their stop losses. That's it. Think about a clear level of support. Traders see price respecting that level multiple times, so they place buy trades there — with their stop losses sitting just below it. They're confident the level will hold again. Then it doesn't. Price sweeps below the support, triggering every stop loss beneath it, before reversing and heading exactly where those traders expected. They were right about direction — just wrong about timing. The same thing happens at resistance. Traders short a level with stops above it. Price spikes through, takes out every stop, then collapses just as the short sellers predicted. This is a liquidity sweep, and it happens every single day across every market. Where Does Liquidity Sit? Below obvious support levels — where buy-side stop losses cluster Above obvious resistance levels — where sell-side stop losses cluster At equal highs and equal lows — price magnets that institutions target before reversing Once you start seeing these levels, you cannot unsee them. Why Institutions Create Liquidity Sweeps This isn't manipulation for its own sake. There's a mechanical reason institutions push price into these zones. Retail traders don't move markets — their order sizes are too small. Institutions do. But that creates a problem: when an institution wants to build a large buy position, they can't get all their orders filled at one price. Every buy order they place pushes price higher, giving them a worse average entry. So instead, they engineer a situation where cheap prices come to them. Here's how it works: Obvious support level forms — retail traders stack their longs there with stops below Institution pushes price into those stops — this triggers a flood of sell orders Institution absorbs the sell transactions — filling their large buy position at the original price they wanted Price reverses and the real move begins The retail traders who got stopped out watch price go exactly where they predicted — without them.
Step 2: Sweep or Run — Knowing the Difference
Not every liquidity grab leads to a reversal. After price takes out a level, you'll see one of two outcomes: A liquidity sweep — price wicks through the level and reverses A liquidity run — price breaks through and continues in that direction For this strategy, you want the sweep. Avoid the run. How to Spot a Run Before It Happens The key is the candle close. If price breaks through a level impulsively — meaning a full candle body closes beyond the level — you're likely looking at a run, not a sweep. Do not enter a reversal trade. What you want to see instead is a wick. Price comes down, spikes below the level, but the candle closes back above it. That wick is the sweep. The body stays near the level, and you get the reversal signal you need. Rule: Wait for the candle to close. Never anticipate impulsive breaks — they almost always signal continuation, not reversal.
Step 3: Execution — How to Actually Enter the Trade
Once you've confirmed a sweep (not a run), here's the full trade execution framework. Timeframes Hourly chart — identify the liquidity level and confirm the sweep 5-minute chart — drill down for entry The Setup (Step by Step) 1. Confirm the sweep on the hourly Price has swept below a clear support level. You're now looking for buy trades only. 2. Mark the Opening Range (9:30–9:45 AM) On the 5-minute chart, draw the high and low of the first 15 minutes of the trading session. This becomes your reference range for the session. 3. Wait for displacement outside the range You want to see a candle break and close outside the opening range with momentum — this is called displacement, and it confirms directional bias. A break and close to the upside after a sweep? You're looking for buys. 4. Identify your Point of Interest (POI) Look for the last red candle before the big green displacement push. That candle creates a demand zone — the level where smart money is likely resting with unfilled buy orders. 5. Wait for price to return to the POI Don't chase. Wait for price to pull back to that demand zone. 6. Get your entry signal Look for a bullish engulfing pattern — a red candle completely engulfed by the following green candle. This is your momentum confirmation that buyers are defending the zone. 7. Execute and manage the trade Enter on the close of the engulfing candle Stop loss: below the recent wick low Take profit: next significant supply zone above Why This Works Every part of this setup confirms the same bias: Liquidity was swept ✓ Displacement confirmed direction ✓ Demand zone respected ✓ Momentum candle confirmed entry ✓ You're not guessing. You're reading a story the market is telling you.
✦ Key Takeaways
- Key Takeaways Liquidity sits where stop losses cluster — below support and above resistance Institutions engineer sweeps to fill large orders at better prices A wick through a level = sweep (trade it). A full candle close through = run (avoid it) Confirm entry with displacement, a point of interest, and a momentum signal The opening range breakout adds an extra layer of confluence Once you learn to read liquidity, you stop being the trader who gets swept out — and start being the trader who profits from the sweep.