Liquidity sweeps happen in every market, every day, but most traders who claim to trade them are really reacting to liquidity grabs, stop hunts, or plain breakouts wearing a sweep's clothing. Mistaking one for another is an expensive habit. A real liquidity sweep can mark exactly where smart money is stepping in and where a reversal is likely to start — but only if you can tell it apart from the moves that look similar and behave completely differently.
What a Liquidity Sweep Actually Is
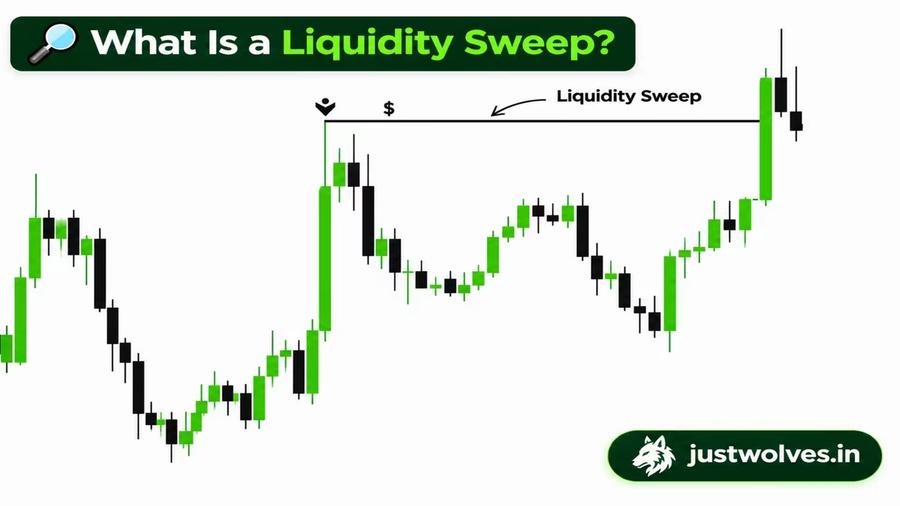
A liquidity sweep is a specific sequence: price pushes through a key level, quickly closes back inside the prior range, and then moves toward liquidity resting on the opposite side. If price sweeps buy-side liquidity above a high, the expectation is a reversal down toward sell-side liquidity at the opposing level — and vice versa.
The pattern shows up almost daily and, when read correctly, tends to align with institutional order flow. But the phrase gets applied far too loosely. Seeing price poke above a high or below a low is not, by itself, a sweep. It only becomes one once you check what kind of level was taken, when it happened, and how price reacted afterward.
Sweep vs Grab vs Stop Hunt vs Breakout
These four patterns can look identical in the first few seconds after price crosses a level. They are not the same trade, and treating them as interchangeable is where most losing "liquidity" setups come from.
Liquidity grab
A small move beyond an obvious internal level — a previous swing high or low inside a range. Price briefly pushes past it, clears nearby retail stops, and reacts quickly, but rarely travels far. These are common on lower timeframes during active sessions and do not, on their own, signal a major reversal. Treating every grab as a reversal setup is a fast way into low-probability trades.
Stop hunt
Not necessarily manipulation — a stop hunt is simply a move that triggers a large cluster of stop-loss orders and uses that liquidity to fuel the next leg. These show up above equal highs or below equal lows, often just before price taps into an unmitigated supply or demand zone and continues in its original direction. The stop hunt feeds a continuation more often than it starts a reversal.
Genuine breakout
Sometimes price takes liquidity, retraces briefly, and instead of reversing, keeps going with real momentum. This is the case that traps traders who blindly fade every level. Not every liquidity event is a reversal signal — sometimes the breakout is the actual move, and the job is telling the difference before entering.
Real liquidity sweep
A real sweep happens at a key external liquidity level — not just any internal high or low. Think major higher-timeframe highs and lows, previous session extremes, or levels around key session opens. Three conditions need to be present: price takes a key external liquidity level, it happens inside a meaningful time window, and price reacts immediately with strong displacement in the opposite direction. Miss any of the three and what looks like a sweep can easily be a trap.
The Three-Question Filter
Before calling anything a "sweep," ask three questions: Is the level external (session high/low, previous day high/low, higher-timeframe swing) rather than just an internal high or low? Did it happen around a meaningful time window? Did price react immediately with strong displacement? If any answer is no, treat it as a grab, a stop hunt, or a possible breakout instead.
Why Timing Matters: Sessions and External Liquidity
A sweep that happens at a random point in the day does not carry the same weight as one that happens around a major session open. Liquidity builds up during quiet periods, and once volume and volatility return, price tends to move toward those resting pools, take the orders, and begin the next expansion. That is why some of the cleanest sweeps cluster around the London and New York opens.
A typical sequence: price pushes higher right around the London open, sweeping the liquidity above the London high, then sharply reverses toward the Asia low — clearing liquidity on both sides before the real move develops. A similar pattern often plays out at the New York open, where price pushes above the London high, sweeps that buy-side liquidity, and then shifts toward the next sell-side target at the London low.
Time is a filter, not a confirmation on its own. A sweep at the right time gives context, but price action still has to confirm that the liquidity event actually caused a meaningful reaction.
Confirming the Sweep: Displacement and CISD
Once liquidity is taken, the instinct to enter immediately is exactly what needs to be resisted. Watch how price reacts after the sweep instead. A high-quality sweep is usually followed by a strong, decisive move away from the level — this is displacement.
If price sweeps a low and simply stays above it, drifts sideways, or slowly grinds lower, there is not enough evidence that buyers have taken control. But if price sweeps the low and then aggressively pushes higher with strong bullish candles, that is a completely different signal — one suggesting institutional money may be entering in the opposite direction.
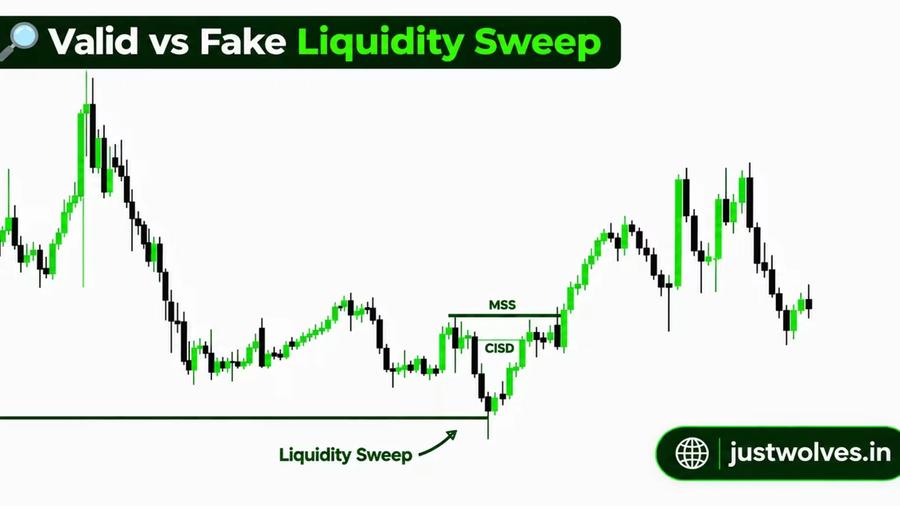
To make the "how much displacement is enough" question more mechanical, use change in the state of delivery (CISD). CISD is confirmed when price closes beyond the origin of the candle sequence that led into the sweep. In a bearish reversal, after price sweeps buy-side liquidity, CISD occurs when price closes below the body of the first bullish candle in the sequence that pushed price into the sweep. In a bullish reversal, after price sweeps sell-side liquidity, CISD occurs when price closes above the origin of the bearish candle sequence that led into the sweep.
Adding CISD to the checklist filters out premature entries from fair value gaps or inversion fair value gaps that form inside the sweep leg itself. Price can still push deeper into a higher-timeframe zone, rebalance more inefficiencies, or even sweep a second time before the real reversal starts — CISD keeps you from jumping in before that process is finished.
The Second Layer: Internal Liquidity
For a more conservative version of the setup, do not enter right after the external sweep. Wait for price to also clear the internal liquidity created after that first sweep — essentially, wait for a liquidity grab inside the reversal structure itself.
In a bullish setup, price may sweep a major low, bounce, attract early buyers, create fresh internal lows as it consolidates, and then come back to sweep those internal lows before the real reversal begins. The mirror version applies in a bearish setup: price sweeps a major high, pulls back, attracts early sellers, creates internal highs, and clears those highs before turning lower.
Smart money does not always reverse the instant it takes higher-timeframe liquidity. Often it clears the major external liquidity first, then removes the newly created internal liquidity, and only after both layers are gone does the true reversal begin. Waiting for both gives the setup meaningfully stronger confirmation before you look for an entry from a fair value gap, order block, or another valid PD array inside the displacement leg.
"The break itself is what you're waiting for — not the touch. Price reaching a level proves nothing; price breaking through it and holding is the first real piece of evidence.
A Mechanical Entry Model
Turning this into a repeatable process means combining a higher-timeframe filter with lower-timeframe execution — mark the level, wait for proof, then drop down for a precise trigger.
From Level to Execution
Mark the external liquidity range
On the 15-minute chart, mark the previous session's high and low (e.g. the Asian range before London opens), or a swing high/low leading into a supply or demand zone. This is the range the next session is likely to target.
Treat the level as inducement, not a signal
Do not react to price simply approaching or recovering toward the level. Treat it as resistance or support that has to prove itself first. If price is rejected there, nothing has changed — no trade.
💡 The mistake most traders make is entering on the recovery itself, before the level has actually been tested.Wait for the higher-timeframe break
If price actually closes through the level on the 15-minute chart, that is confirmation the level is no longer holding price back. This break — not an order block or fair value gap at this stage — is the condition you were waiting for.
Confirm displacement and, ideally, CISD
Check that the break is followed by a strong, decisive move away from the level rather than a slow drift. Where possible, confirm CISD — a close beyond the origin of the candle sequence that led into the sweep — and, for a more conservative entry, wait for the internal liquidity created after the break to be cleared as well.
Drop to the 1-minute chart for execution
Come down to the 1-minute chart to watch how price is actually moving through the same level you marked higher up. Look for a strong displacement candle pushing through it — that candle is the trigger, not a prediction made in advance.
Enter on the break, stop below the trigger candle
Take the entry once the lower-timeframe break confirms. Place the stop-loss on the other side of the large trigger candle. From here, management takes over — you are no longer looking for another entry.
Where to Look for the Precise Entry
An entry from a fair value gap, order block, or inversion fair value gap only becomes high probability once it sits inside the displacement leg that followed a confirmed sweep. The same zone touched without a prior sweep and break carries much lower odds of holding.
Managing the Trade After Entry
Getting the entry right is only half the process — and it is the half most traders over-focus on. Once you are in the trade, the job changes completely: you stop looking for another entry and start reading how price behaves as it moves toward the target.
Rather than watching the profit number or waiting on a fixed take-profit, track the structure price is building in real time. As the move develops, mark each new equal high forming above and the protective low forming underneath. Keep updating both as the trade continues — the goal is to let the price structure itself tell you what is happening, not emotion or a static target.
Reading the equal highs
Each time price reaches one of the equal highs you have marked, there is one question that matters: does it break, or does it get rejected? A break means buyers have successfully pushed through a previous high again — the bullish behavior you want to see while holding a buy. A rejection at that level is not, by itself, a reason to close the trade, but it is a warning. If buyers cannot keep breaking these highs, something in the move may be changing, and it is time to pay closer attention to the protective low.
Reading the protective low
While the trade is running, the protective low underneath is what tells you whether the bullish structure is still intact. As long as price respects that level, there is no reason to panic even after a rejection at the highs. But if price comes down and breaks that low, the bullish structure is damaged and a genuine bearish move can start developing — the point where the trade can begin moving against you if it continues.
Keep updating both levels as new highs and lows form; the trade is managed as price moves, not after the fact. If the bullish structure keeps holding, keep holding. If price fails to make a new higher high and instead gets rejected and turns back down, treat that as a genuine warning rather than an automatic exit — recognize it, and let the next structure test confirm or deny it. For traders who prefer a simpler exit, a fixed target such as 2.5R to 3R off the entry, or the next key opposing liquidity level, works as an alternative to full structure-based management — but it will not adapt to a trade that starts warning you early the way structure tracking does.
Common Mistakes
Entering the moment price touches a level instead of waiting for it to actually break is the single most common error — a touch proves nothing on its own. Close behind it is calling every internal high or low sweep a reversal signal, which is really just trading liquidity grabs and stop hunts under the wrong name. A third mistake is fading a level with no displacement or CISD behind it, which is frequently just the start of a genuine breakout. And after entry, the most common failure is switching to a fixed target and then ignoring the structure the trade itself is creating — missing the early warning a rejected equal high or a broken protective low would have given.
Key Takeaways
✦ Liquidity Sweep Trading — What to Remember
- A real sweep takes external liquidity (session high/low, previous day high/low, higher-timeframe swing) — not just any internal high or low
- Liquidity grabs and stop hunts often fuel continuation rather than reversal; do not treat every one as a reversal signal
- A genuine breakout can look identical to a sweep in the first few seconds — displacement and CISD are what separate them
- Sweeps around session opens (London, New York) carry more weight than sweeps at random times; time is a filter, not a confirmation
- CISD — a close beyond the origin of the candle sequence leading into the sweep — makes the displacement confirmation mechanical
- For stronger setups, wait for both external liquidity and the internal liquidity created after the first sweep to be cleared
- Mark the key level on a higher timeframe, wait for a real break, then drop to a lower timeframe for the precise entry candle
- Once in the trade, stop looking for entries and start tracking the structure — mark new equal highs and the protective low as they form
- A broken equal high with no follow-through is a warning, not an exit signal; a broken protective low means the structure is damaged
- Manage the trade with the structure it creates in real time rather than a static target or the profit number alone
Frequently Asked Questions
What is the difference between a liquidity sweep and a liquidity grab?
A liquidity grab is a shallow move beyond an obvious internal high or low that clears nearby retail stops and does not, on its own, signal a major reversal. A liquidity sweep takes a key external level — a session high/low, previous day high/low, or higher-timeframe swing — during a meaningful time window, and is followed immediately by strong displacement in the opposite direction. Grabs are common and mostly noise; sweeps are the setups worth acting on.
How is a stop hunt different from a liquidity sweep?
A stop hunt triggers a cluster of stop-loss orders, usually around equal highs or lows, and uses that liquidity to fuel the next leg — which is often a continuation of the existing trend rather than a reversal. A liquidity sweep specifically targets external liquidity and reverses. Confusing the two means fading moves that are actually about to continue in the original direction.
What is CISD and why does it matter?
CISD (change in the state of delivery) is confirmed when price closes beyond the origin of the candle sequence that led into the sweep — for example, closing below the body of the first bullish candle in a bearish reversal setup. It turns the vague question of "how much displacement is enough" into a specific, mechanical rule, which helps filter out early entries from fair value gaps that form before the reversal is actually confirmed.
Should I enter as soon as price sweeps a key level?
No. Entering on the sweep itself is one of the most common mistakes. Wait for price to break back through with displacement, ideally confirmed with CISD, and for a more conservative approach, wait for the internal liquidity created after that break to be cleared as well before looking for an entry.
How do I manage a trade after getting the entry right?
Stop looking for another entry and start marking the structure price creates as it moves — new equal highs above and a protective low underneath. A broken equal high is bullish continuation; a rejection at an equal high is a warning, not an automatic exit. A break of the protective low means the structure is damaged and the trade may be turning against you. Update both levels continuously rather than watching a fixed target alone.
Can a liquidity sweep just turn into a breakout instead of a reversal?
Yes, and this is exactly what the three-question filter and displacement/CISD checks are for. Sometimes price takes liquidity, retraces briefly, and then continues with real momentum instead of reversing. Without confirmation from displacement and a meaningful time window, what looks like a sweep can easily be the start of a genuine breakout in the original direction.
Topics