More than 90% of intraday traders lose money. The most common reason is not a lack of strategy — it is picking the wrong stock at the wrong time. Buying a stock that institutions are aggressively selling, or shorting a stock that big money is accumulating, guarantees a painful outcome no matter how good your chart analysis is. The solution is a free screener that shows you exactly what the smart money is doing across five timeframes — before you place a single trade.
Why Most Traders Pick the Wrong Stocks
Most retail traders select stocks based on tips from Telegram groups, YouTube recommendations, or gut instinct. None of these approaches tell you what institutional investors — FIIs, DIIs, mutual funds, and large HNIs — are actually doing in that stock right now. When you trade against the institutional flow, you are on the wrong side of the largest orders in the market.
The screener approach is different. Instead of guessing, you read the market's own momentum data across five timeframes. You see — before the market opens — whether strong buying or strong selling is happening on a monthly, weekly, daily, hourly, and 15-minute basis. When all five timeframes align in one direction, the probability of a profitable trade in that direction is significantly higher than any tip or guess could achieve.
Completely Free Strategy
This strategy uses only free tools. No paid subscriptions, no signal services, no Telegram groups. The screener is publicly available and works for any Indian stock or index.
The Free Tool: Investing.com Stock Screener
The tool at the centre of this strategy is the free stock screener on Investing.com. Navigate to investing.com, click on the Stock Screener at the top, and select India as your country. You will see a list of stocks sorted by market capitalisation — Reliance, HDFC Bank, Infosys, and others at the top.
Click on the Technicals tab within the screener. This is where the five-timeframe momentum data appears. For each stock, you will see momentum signals across five columns: 15 minutes, hourly, daily, weekly, and monthly. Each column shows one of four readings: Strong Buy, Buy, Neutral, Sell, or Strong Sell.
These momentum readings are generated from a composite of technical indicators including moving averages, RSI, MACD, and volume analysis. You do not need to understand each indicator individually — the screener does the aggregation for you. Your job is to read the output and apply the decision framework below.
How to Access the Screener
Go to investing.com → Stock Screener → select India → click Technicals. The five timeframe columns are your signal dashboard. This is the only screen you need before deciding which stocks to trade each day.
The 5-Timeframe Momentum Framework
Each of the five timeframes tells you something different about who is in control of a stock and for how long.
✦ What Each Timeframe Tells You
Monthly
What big institutions have been doing for weeks — the dominant long-term trend
Weekly
What major players did in the last 5 sessions — the medium-term trend direction
Daily
What is happening today — whether the current session confirms the larger trend
Hourly
The last hour of trading — short-term momentum and intraday trend direction
15-Min
The last 15 minutes — the most recent micro-momentum signal for precise timing
The key principle is alignment. When all five timeframes show the same signal — for example, Strong Sell across monthly, weekly, daily, hourly, and 15-minute — there is powerful institutional consensus behind that direction. Trading in the direction of full alignment gives you the highest-probability setup available in the screener.
When timeframes conflict — for example, monthly and weekly showing selling but 15-minute and hourly showing buying — the signal is mixed. This is useful information too: it tells you the stock is in short-term consolidation or reversal against the dominant trend, which creates different opportunities for intraday versus swing traders.
Intraday Strategy: Focus on 15-Minute and Hourly
For intraday traders whose positions are opened and closed within the same day, the most relevant timeframes are the 15-minute and hourly columns. These reflect what the market is doing right now — not what happened last week or last month.
The intraday rule is simple: if both the 15-minute and hourly signals are Strong Buy or Buy, you look for a long (buy) entry. If both show Strong Sell or Sell, you look for a short entry. The daily, weekly, and monthly signals provide context but do not drive the intraday decision.
This approach works because short-term momentum is what actually moves intraday prices. Even if a stock has been in a long-term downtrend, a 15-minute and hourly buying signal means short-term buyers are in control — and riding that momentum for a few hours can be profitable.
The Intraday Rule
For intraday trades: check only 15-minute and hourly. If both are buying — go long. If both are selling — go short. If they conflict — skip that stock and find one where they agree.
Swing Strategy: Focus on Daily, Weekly, and Monthly
Swing traders hold positions for several days to weeks. For them, the 15-minute and hourly signals are noise — too short-term to be relevant for a multi-day hold. What matters for swing trading is the alignment of daily, weekly, and monthly signals.
The swing rule: if daily, weekly, and monthly all show the same direction — Buy or Strong Buy — the stock is in a confirmed multi-timeframe uptrend and is suitable for a swing long. If all three show Sell or Strong Sell, the stock is in a confirmed downtrend suitable for a swing short or for avoiding.
If the three swing timeframes conflict — for example, monthly is selling but daily and weekly are buying — there is no clear swing setup. The stock may be in a bottoming process or a dead-cat bounce. Wait for alignment before committing capital to a swing position.
✦ Intraday vs Swing — Which Timeframes to Watch
- Intraday: 15-minute + hourly alignment drives the decision
- Swing: daily + weekly + monthly alignment drives the decision
- Full alignment (all 5 timeframes): highest-conviction trade for both strategies
- Mixed signals: no trade — wait for clarity or find a different stock
Live Examples: Reliance, HDFC Bank, and Titan
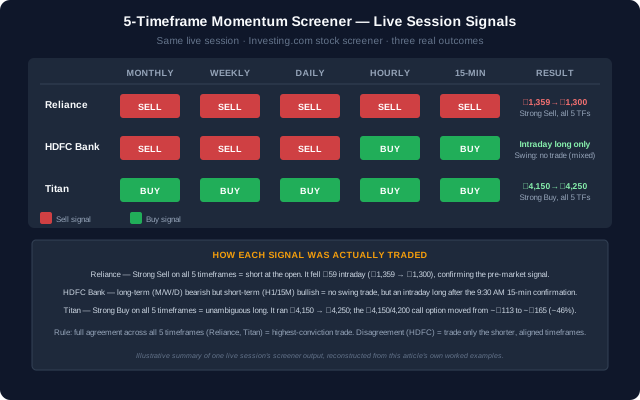
Reliance Industries — all five timeframes: Strong Sell
On a live market session, Reliance showed Strong Sell across all five timeframes — monthly, weekly, daily, hourly, and 15-minute. This is the clearest signal the screener can produce. The implication: institutional players at every time horizon are selling Reliance. For an intraday trader, this means short-selling Reliance at the open. For a swing trader, this means avoiding Reliance entirely — or shorting with a multi-day hold.
The result validated the screener's output: Reliance opened at ₹1,359 and dropped to ₹1,300 in a single session — a ₹59 intraday move. A trader who shorted at the open with proper position sizing made a significant return in one day. This was not a coincidence — the screener had flagged the selling pressure before the market opened.
HDFC Bank — monthly/weekly/daily: Sell, hourly/15-min: Buy
HDFC Bank showed a mixed signal on the same session. Monthly, weekly, and daily indicated selling — meaning the dominant trend was bearish. But hourly and 15-minute showed buying — meaning short-term buyers had stepped in.
For a swing trader: no trade. The long-term trend is against a buy, and the short-term signal is not strong enough to enter against three bearish timeframes. For an intraday trader: the 15-minute and hourly buying signal is an intraday long opportunity. HDFC Bank had an initial dip in the first 15 minutes and then ran consistently upward for the rest of the session. An intraday buyer who entered after confirming the 15-minute signal at 9:30 AM captured a meaningful move.
Titan — all five timeframes: Strong Buy
Titan showed Strong Buy across all five timeframes on the same live session. This is the bullish equivalent of the Reliance setup. For both intraday and swing traders, the signal is unambiguous: buy Titan. The stock opened around ₹4,150 and ran to ₹4,250 within the session. An options trader who bought the ₹4,150 or ₹4,200 call option at market open saw the option price move from approximately ₹113 to ₹165 — a gain of around 46% in a single intraday session.
"When all five timeframes align in one direction, the screener is not predicting — it is confirming what institutional money is already doing. You are not guessing; you are following the flow.
Options Trading with This Screener
The screener works equally well for options traders. The five-timeframe signal tells you the direction; your options chain selection determines the instrument.
When the screener shows Strong Buy across all timeframes for a stock, buy a call option at or near the at-the-money strike for the current monthly expiry. When the screener shows Strong Sell, buy a put option. For intraday options trades, at-the-money strikes have the best combination of liquidity, delta, and price sensitivity.
The Titan example above illustrates the leverage available: a ₹52 gain on a ₹113 premium is a 46% return in a single session on a stock that moved roughly 2.4% in the underlying. Options amplify the move, but they also amplify the loss if the signal fails — always size options positions conservatively and treat the full premium as your maximum risk.
Options Entry Rules
For options: Strong Buy signal → buy ATM call. Strong Sell signal → buy ATM put. Use the current monthly expiry for better liquidity. Never risk more than you are willing to lose entirely on a single options position.
What to Do When Signals Are Mixed
Not every stock will give you a clean five-timeframe alignment. Bharti Airtel, for example, showed Neutral on 15 minutes and mixed signals across other timeframes on the same live session. The correct response to a mixed signal is simple: skip that stock.
There are always enough stocks in the Nifty 50 or Nifty 500 universe with clear alignment on any given day. You do not need to force a trade in an ambiguous stock. Filter through the screener until you find stocks with at least 2-out-of-2 alignment for intraday (15-min and hourly both in the same direction) or 3-out-of-3 alignment for swing (daily, weekly, monthly all in the same direction). If you can find 5-out-of-5 alignment, that is your highest-priority trade.
Infosys, on the same session, showed buying on 15-minute and hourly but selling on daily, weekly, and monthly. For an intraday trader, this is a cautious long. For a swing trader, this is not a trade at all. The distinction matters because taking a swing long in Infosys when the long-term trend is bearish is swimming against the institutional current.
Entry Timing: Why 9:30 AM Is the Sweet Spot
The optimal time to apply this screener is between 9:30 AM and 9:35 AM. Here is why.
At 9:15 AM when the Indian market opens, the 15-minute column on the screener reflects the previous day's last 15-minute signal — not today's. The first 15-minute candle of the day runs from 9:15 AM to 9:30 AM. By 9:30 AM, the screener's 15-minute column has updated to reflect the actual opening 15 minutes of the current session. This gives you the most relevant short-term momentum reading of the day.
Entering a trade based on the 9:30 AM screener reading means your stop-loss reference is the high or low of the first 15-minute candle — a clear, well-defined level. You enter on the second 15-minute candle, with a stop on the other side of candle one's extreme, and a target at the next key level or at 3:15 PM to 3:30 PM for intraday exits.
Wait for 9:30 AM
Do not apply this screener at 9:15 AM. Wait until 9:30 AM when the first 15-minute candle has completed. The 15-minute column then reflects today's actual opening momentum — not yesterday's closing data.
The Complete Trade Execution Process
At 9:25–9:28 AM: Open the screener
Go to investing.com → Stock Screener → India → Technicals. The screener will be ready. Do not act yet — wait for the first candle to complete.
💡 Bookmark the direct link to the India technicals screener so you can access it in seconds each morning.At 9:30 AM: Read the five timeframes
Scan through the top Nifty stocks. Look for stocks with clear alignment. Prioritise: all-5 alignment first, then 4-out-of-5, then 2-out-of-2 for the relevant timeframes of your strategy.
Identify the trade direction
If the relevant timeframes show Buy or Strong Buy — prepare to go long. If they show Sell or Strong Sell — prepare to short-sell (equity/futures) or buy a put (options). If signals are mixed — skip the stock.
Enter on the second 15-minute candle
Let the first 15-minute candle (9:15–9:30) complete and close. Enter your position at the open of the second candle (approximately 9:30–9:35). This gives you a confirmed opening candle as your reference.
💡 For equity and futures: enter at market price. For options: buy ATM calls (bullish) or ATM puts (bearish) at the current ask.Set stop-loss at the first candle extreme
For a long position: stop-loss below the low of the first 15-minute candle. For a short position: stop-loss above the high of the first 15-minute candle. Give the stop a small buffer for spread and volatility.
Set your target or exit by 3:15–3:30 PM
For intraday trades, the absolute latest exit is 3:15 to 3:30 PM. For equity positions, your broker will close positions at 3:20 PM. Set a target at the next key support/resistance level, or let the position run to the time-based exit.
Risk Management and Realistic Win Rate
No strategy works 100% of the time. The honest reality of this screener approach is a win rate of approximately 60% to 80% across a sufficient sample of trades. That means 20% to 40% of trades will be losers. The profitability comes from ensuring that winners are larger than losers — achieved through a minimum 1.5:1 or 2:1 risk-to-reward ratio on every trade.
Position sizing is critical. Risk no more than 1% to 2% of your total capital on any single intraday trade. If your trading capital is ₹5 lakh, your maximum loss per trade is ₹5,000 to ₹10,000. This discipline ensures that a string of losing trades does not wipe out your account before the winning trades can recover the capital.
The screener improves confidence and selection quality — it does not eliminate losses. What it does is increase the probability that when you win, you are riding institutional momentum rather than fighting it. Over 60 to 100 trades, that probability difference compounds into a meaningful edge.
The Math of a Winning Strategy
A 65% win rate with a 2:1 risk-reward ratio means: for every ₹100 risked, your expected return is ₹65 × ₹200 gain minus ₹35 × ₹100 loss = ₹130 − ₹35 = ₹95 net profit. That is the mathematics of consistent profitability.
Key Takeaways
✦ Intraday and Swing Stock Selection — What to Remember
- Use the free Investing.com stock screener → India → Technicals for five-timeframe momentum data
- Five timeframes: 15-minute, hourly, daily, weekly, monthly — each tells you a different time-horizon story
- Intraday rule: 15-minute and hourly must both agree — Strong Buy = go long, Strong Sell = go short
- Swing rule: daily, weekly, and monthly must all agree — full alignment = high-conviction swing trade
- Full five-timeframe alignment = highest-priority trade; all-5 Strong Sell → short-sell; all-5 Strong Buy → buy
- Apply the screener at 9:30 AM, not 9:15 AM — the first 15-minute candle must have closed first
- Enter on the second 15-minute candle; stop-loss at the first candle extreme
- For options: Strong Buy → ATM call; Strong Sell → ATM put; current monthly expiry
- Mixed signals = no trade — there are always better opportunities elsewhere in the screener
- Risk management: 1–2% of capital per trade maximum; minimum 1.5:1 risk-reward ratio
- Expected win rate: 60–80% — losses are part of the process, not a reason to abandon the strategy
Frequently Asked Questions
Is Investing.com completely free to use for this strategy?
Yes. The stock screener and technicals data on Investing.com is free. You do not need to create an account or pay for any subscription to access the five-timeframe momentum readings for Indian stocks. Simply search for investing.com, go to the Stock Screener, select India, and click Technicals.
Can I use this strategy for Nifty and Bank Nifty options?
Yes, though the screener shows individual stock data rather than index data directly. For Nifty index options, look at the five-timeframe signals for the top Nifty 50 stocks as a proxy for the index direction. If Reliance, HDFC Bank, TCS, and Infosys are all showing Strong Sell, the Nifty index is very likely to be under pressure as well. Use this as confirmation before buying Nifty puts.
What if the stock gaps up or down at the open and the first candle is very large?
A large first candle means a wide stop-loss if you use the candle extreme as your reference. In this case, reduce your position size proportionally so that if the stop is hit, you still lose no more than 1–2% of your capital. Alternatively, wait for a pullback to a better entry level rather than chasing the open gap.
How do I differentiate between a short-term bounce and a genuine trend reversal?
Check the higher timeframes. If monthly, weekly, and daily are all showing Strong Sell but 15-minute and hourly have flipped to Buy, you are likely seeing a short-term intraday bounce — not a trend reversal. Use the intraday buy signal for a quick intraday long trade but do not hold it overnight or convert it into a swing position. Trend reversals require the higher timeframes to start shifting as well.
When should I exit an intraday trade before 3:15 PM?
Exit early if: (a) the 15-minute signal reverses against your position, (b) your target level is hit, or (c) a high-impact news event is scheduled that could cause a sharp spike. Do not hold intraday equity positions past 3:20 PM — your broker will close them anyway. For intraday options, exit by 3:15 PM even if the position is in a loss, to avoid the risk of holding options through overnight price decay.
How many stocks should I trade per day using this strategy?
Start with one stock per day. Focus on the stock with the clearest five-timeframe alignment and trade that one well. Once you are consistently profitable with one trade per day over 30 to 60 trading sessions, you can consider adding a second stock. Over-trading is one of the primary reasons skilled traders underperform — more trades does not mean more profit if selection quality drops.
Topics