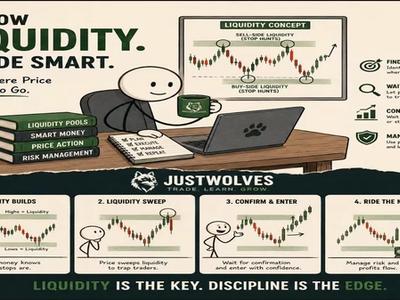
Gold (XAUUSD) is the most manipulated instrument in retail forex. Every session, the price systematically sweeps obvious liquidity levels — stop-loss clusters below equal lows, buy stops above equal highs, previous day extremes — before reversing hard in the opposite direction. The ICT (Inner Circle Trader) methodology explains exactly why this happens and how to use it as an entry trigger rather than a loss. The critical insight from the video: a liquidity sweep alone is not enough. The swept level must align with a higher-timeframe key level. Without that alignment, the sweep is a trap that will double-sweep and run your stop before the real move begins.
Why Gold Traps Retail Traders Every Session
Gold trades over $200 billion per day. The participants are central banks, sovereign wealth funds, bullion banks, hedge funds, and institutional traders — not retail. When a retail trader places a buy stop above an obvious high or a sell stop below an obvious low, that order is visible in the aggregated market. Institutional algorithms know exactly where those clusters are.
The mechanism is simple: smart money needs liquidity to fill large orders. They drive price into a stop cluster — above the previous day high, into equal highs, beyond a session high — triggering a wave of retail orders. Once those orders are filled and the smart money is positioned, price reverses and moves in the institutional direction. The retail trader who entered on the breakout is immediately on the wrong side.
Understanding this process is the first step. The second step — which most traders never reach — is learning to use the sweep as a precise entry trigger in the institutional direction.
The ICT Market Maker Model
Gold is not random. It follows a predictable engineered sequence: accumulate → manipulate (sweep liquidity) → distribute. Every session high and low, every previous day extreme is a target. The strategy is to trade the reversal after the manipulation — not the breakout during it.
The 5 Key Levels Every Gold Trader Must Know
Not all price levels carry equal institutional significance. The ICT framework ranks key levels by the probability that price will respect or reverse from them. For gold trading, these five categories — in order of importance — form the foundation of every trade decision.
✦ Key Level Hierarchy for XAUUSD
PDH / PDL
Previous Day High and Low — highest short-term institutional significance
Session H/L
Asian, London and New York session extremes — major intraday targets
Weekly H/L
Weekly highs and lows — institutional targets for multi-day moves
FVG
Fair Value Gap — imbalance that price revisits with high probability
Order Block
Last institutional candle before a strong displacement — reversal magnet
Session Highs and Lows
The forex day is divided into three main sessions: Asian (21:00–06:00 UTC), London (07:00–16:00 UTC), and New York (12:00–21:00 UTC). Each session forms a high and a low that acts as a liquidity magnet for the next session.
The Asian session high and low are the most reliable targets. London opens and almost always takes one side of the Asian range before establishing direction. If the Asian high is swept at London open, gold is likely bullish for the London session. If the Asian low is swept, gold is likely bearish. This pattern repeats daily with remarkable consistency.
Mark the Asian session high and low on your chart every day. When London opens (07:00 UTC), watch for price to move toward one of these levels. The sweep of the Asian range followed by a market structure shift is one of the cleanest ICT setups available on XAUUSD.
Related: Live Market Hours Clock
Track Asian, London and NY session highs/lows in real time → Live Market Hours Clock · justwolves.in/tools/market-hours
Previous Day High and Low (PDH / PDL)
The previous day high (PDH) and previous day low (PDL) are the most important short-term key levels on any chart. They represent the full range of institutional activity from the prior session — the highest price buyers were willing to pay and the lowest price sellers were willing to accept.
Smart money treats PDH and PDL as target levels. In a bearish environment, price is drawn up toward the PDH to take buy stops before reversing down. In a bullish environment, price is drawn down toward the PDL to take sell stops before reversing up.
The key rule from the video: if the market sweeps the previous day high, do not enter immediately. Wait. Check if there is a fair value gap or order block above the PDH — a structural reason for the reversal. If there is, the sweep is high probability. If there is not, the sweep may be followed by another sweep higher (double manipulation).
Fair Value Gaps (FVGs) on XAUUSD
A Fair Value Gap (FVG) is a three-candle imbalance pattern. When a strong displacement candle moves so fast that no trading occurred in the gap between the first and third candle's extremes, it creates an imbalance. Price typically returns to fill this gap because institutional algorithms seek to pair unfilled orders.
For gold trading, FVGs on the H1 and H4 timeframes are the most significant. A bearish FVG above current price in a premium zone acts as a sell-side entry point. A bullish FVG below current price in a discount zone acts as a buy-side entry point.
The critical distinction: an FVG is not a standalone entry. It is a point of interest (POI) that becomes high probability only when price reaches it after a liquidity sweep. An FVG that price touches without a prior sweep has a much lower probability of holding.
Reference: Understanding Fair Value Gaps — BabyPips
Deeper explanation of FVG mechanics → Understanding Fair Value Gaps — BabyPips · www.babypips.com/learn/forex/fair-value-gaps
Order Blocks on XAUUSD
An order block is the last opposing candle before a strong institutional displacement. In a bullish displacement, the last bearish candle before the move up is the bullish order block. In a bearish displacement, the last bullish candle before the move down is the bearish order block.
Order blocks represent zones where institutions placed large orders. Price frequently returns to these zones because unfilled institutional orders remain there. When price returns to an OB after a liquidity sweep, the remaining institutional orders absorb selling/buying pressure and the move resumes in the original direction.
For XAUUSD, H1 order blocks are the most reliable for intraday trading. H4 order blocks work for swing setups. The most powerful scenario — used extensively in the video — is when an order block sits just above a swing high or just below a swing low. The price sweeps the swing level into the OB and reverses. This is the complete manipulation-to-entry sequence.
The Key Level Filter — Why It Changes Everything
This is the most important concept in the video. Before placing any trade based on a liquidity sweep, ask one question: is there a key level (OB, FVG, PDH, PDL, session high/low) at or just beyond the swept level?
If the answer is yes: the sweep is a high-probability reversal. Enter after the market structure shift.
If the answer is no: the sweep is likely a manipulation that will be followed by another sweep. Wait. The market will create a new high or low, sweep it, and then — if there is now a key level above/below — that second sweep becomes the entry.
"The market does not just take liquidity once. Without a key level above, a sweep of the high will be followed by a sweep higher. The key level is the institutional reason to reverse — without it, there is no reason for price to stop.
Core Rule: Always Align the Key Level
The Key Level Filter rule: after a liquidity sweep, look up (for a short) or down (for a long) — is there an OB, FVG, PDH or weekly high in that region? If yes — that is your setup. If no — wait for the second sweep and check again.
Premium and Discount Zones
Premium and discount zones are derived from the current price range — defined by the most recent significant swing high and swing low. The midpoint (equilibrium) divides the range into two halves: the upper half is premium and the lower half is discount.
The rule: only look for short setups when price is in the premium zone. Only look for long setups when price is in the discount zone. Entering a short in the discount zone means you are selling at low prices — against the institutional flow. Entering a long in the premium zone means you are buying at high prices — where institutions are distributing.
For gold, use the most recent H4 swing high and swing low to define the range. Calculate the midpoint as (swing high + swing low) / 2. If current gold price is above the midpoint, you are in premium — only look for shorts. If below the midpoint, you are in discount — only look for longs.
✦ Premium vs Discount — Entry Rules
Premium Zone
Price above 50% midpoint — SHORT setups only. Look for bearish FVGs, bearish OBs, PDH sweeps.
Discount Zone
Price below 50% midpoint — LONG setups only. Look for bullish FVGs, bullish OBs, PDL sweeps.
Top-Down Multi-Timeframe Analysis for Gold
The ICT methodology requires a top-down approach: start with the highest timeframe to determine bias and major key levels, then drill down to find the entry. Skipping this sequence — jumping directly to a 15-minute chart to look for setups — is how most traders get trapped.
For gold, the correct sequence is: daily for bias and major levels, H4 for structure and premium/discount, H1 for swing highs/lows and POIs, 15M for market structure shift confirmation, 1M for precise entry using CISD.
Gold Trading Top-Down Sequence
Identify Bias
Is price making lower highs and lower lows (bearish) or higher highs and higher lows (bullish)? Mark daily FVGs, daily OBs, and daily PDH/PDL.
Confirm Structure
Identify the H4 swing high and swing low. Calculate premium/discount midpoint. Mark H4 FVGs and OBs above/below current price.
Mark Key Entry Levels
Identify H1 swing highs and lows. Mark H1 OBs and FVGs. Note which H1 swing is near a higher-timeframe key level (PDH, H4 OB, etc.).
Wait for Liquidity Sweep
Watch for a wick that takes the H1 swing high (for shorts) or H1 swing low (for longs). Check that a key level aligns. Wait for the candle to close back inside.
Confirm MSS
After the sweep, wait for a 15M candle to close below a recent swing low (bearish MSS) or above a recent swing high (bullish MSS). This confirms the reversal.
Enter on FVG / OB Retest
Drop to 1M and find the CISD (Change in State of Delivery) confirmation. Enter on the nearest 15M or 1M FVG/OB. Stop above/below swept level + $3 buffer.
The Complete ICT Entry Model for Gold
The following step-by-step process combines every element above into a single, repeatable trade execution framework. Follow every step in sequence — skipping any step reduces the probability of success.
ICT Gold Entry Model — Step by Step
Determine daily bias
Check the daily chart. Are the last 3–5 daily closes making lower lows (bearish) or higher highs (bullish)? This is your directional filter for the entire trading day. Only take setups in this direction.
💡 If you are unsure of daily bias, wait for a clear break of a recent daily swing high or low before committing to a direction.Mark PDH, PDL and session highs/lows
Before each session, mark the previous day high, previous day low, and the prior session's high and low (Asian session high/low at London open, for example). These are your primary liquidity targets.
💡 Use horizontal lines on your chart. PDH = yellow/orange, PDL = blue, session H/L = white. Consistent colour-coding saves time during fast moves.Identify the premium/discount zone (H4)
Find the most recent H4 swing high and swing low. Midpoint = (swing high + swing low) / 2. If bearish bias and price is above midpoint (premium): look for shorts only. If bullish bias and price is below midpoint (discount): look for longs only.
Mark H1 FVGs and OBs at the swing level
Identify the most recent H1 swing high (for shorts) or swing low (for longs). Check if there is an H1 OB or FVG at or just above/below the swing level. If yes — you have a key level alignment. This is your target sweep zone.
💡 The OB or FVG above the swing high is what gives you confidence the sweep will be a genuine reversal rather than a fake-out.Wait for the liquidity sweep
Do not enter when price approaches the swing level. Wait for a candle wick to pierce it — ideally taking the PDH or session high too — and then close back below it. This is the sweep. The body closing back inside is confirmation the level was targeted, not broken.
Confirm market structure shift (MSS) on 15M
After the sweep, watch the 15M chart. A bearish MSS is confirmed when a 15M candle closes below the most recent 15M swing low. A bullish MSS is confirmed when a 15M candle closes above the most recent 15M swing high. This is your signal that the reversal has begun.
Drop to 1M and enter on FVG/OB with CISD
After the 15M MSS, drop to the 1M chart. Look for a Change in State of Delivery (CISD) — the market shifting from bearish delivery to bullish or vice versa. Enter on the nearest 15M or 1M FVG or OB that aligns with the entry zone.
💡 For gold, enter at the 50% level of the FVG or OB (the midpoint of the zone) for the best balance of entry price and confirmation.Set stop and target
Stop loss: place above the swept high (for shorts) or below the swept low (for longs) with a $3–5 buffer for spread and volatility. Target: aim for the most recent significant swing low (for shorts) or swing high (for longs), or the opposite session extreme. Minimum R:R = 1:2.
💡 Use the free Risk/Reward Calculator at justwolves.in/tools/risk-reward to verify your R:R before entering.
Related: Risk/Reward Calculator
Calculate your R:R ratio before entering any gold trade → Risk/Reward Calculator · justwolves.in/tools/risk-reward
ICT Kill Zones for XAUUSD
ICT defines kill zones as specific time windows when institutional orders are most active and the probability of finding a valid sweep-and-reverse setup is highest. For gold, two kill zones are critical: the London Kill Zone and the New York Open Kill Zone.
Outside of these windows — during the middle of the US session or late Asian session — gold often drifts with low volume and produces many false signals. The manipulation sweeps that define ICT setups require institutional participation to be clean and decisive.
✦ ICT Kill Zones for Gold (XAUUSD)
07:00–10:00 UTC
London Kill Zone — highest-probability gold setups. Asian range swept, London direction established. Mark Asian H/L the night before.
12:00–15:00 UTC
NY Open Kill Zone — second major window. London session high or low often swept at NY open. Gold frequently makes the daily high or low in this window.
00:00–04:00 UTC
Asian Kill Zone — range-formation period. Low volatility. Sets up the Asian high/low that London will target. Watch, do not trade.
15:00–17:00 UTC
London Close Kill Zone — profit-taking and position squaring. Can produce sharp reversals. Lower probability than the morning windows.
Related: Live Market Hours Clock with Kill Zone Tracker
See exactly which kill zone is active right now → Live Market Hours Clock with Kill Zone Tracker · justwolves.in/tools/market-hours
Live Gold Trade Examples
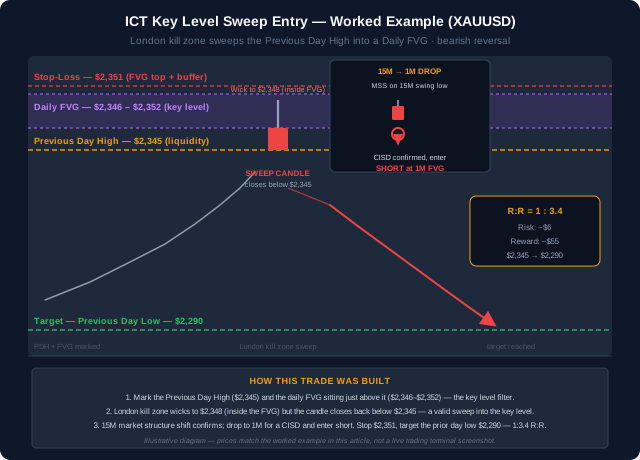
Example 1: Daily FVG + Previous Day High Sweep
The market is in a bearish daily trend. Price is in the premium zone. The previous day high is marked at $2,345. Above the PDH, there is a daily fair value gap between $2,346 and $2,352.
During the London kill zone, price sweeps the PDH to $2,348 — entering the daily FVG — and the candle closes back below $2,345. This is the liquidity sweep into a key level. The sweep is valid: PDH was the liquidity target and the daily FVG above it is the key level.
On 15M, a market structure shift is confirmed as price closes below the most recent 15M swing low. Drop to 1M. A bearish CISD appears. Enter short at the 15M FVG below. Stop: $2,351 (above the FVG with $3 buffer). Target: $2,290 (previous day low). R:R = 1:3.4.
Example 2: H1 Order Block + Swing High Sweep
Price is bearish on the daily. H4 range shows price in the premium zone. On H1, there is a swing high at $2,330. Immediately above the swing high sits a bearish H1 order block between $2,332 and $2,338.
During the NY open kill zone, price sweeps the $2,330 H1 swing high with a wick to $2,334 — entering the H1 OB — and closes back at $2,328. Key level alignment confirmed: the OB above the swing high is the institutional reason for the reversal.
On 15M, MSS is confirmed. Drop to 1M. Enter short at the 15M FVG that formed on the swing. Stop: $2,341 (above OB + buffer). Target: $2,295 (H1 swing low). R:R = 1:2.8.
Common Mistakes Gold Traders Make
The following mistakes are responsible for most losing trades in gold when attempting to use the ICT approach. Each one can be directly traced to a step in the entry model being skipped or rushed.
✦ Mistakes to Eliminate
- Entering on the sweep without checking for a key level alignment — the most common mistake, and the one the video specifically teaches to avoid
- Using the current session's swing high as the range definition instead of using H4 swings for the premium/discount zone
- Entering at the order block without waiting for the liquidity sweep first — OBs that are tagged without a prior sweep are often ignored by price
- Taking trades outside kill zones — mid-session drift looks like structure but has no institutional backing
- Placing stop below the FVG entry instead of above the swept high — the correct stop is above the swept level, not below the POI
- Confusing a market structure shift with a single candle close — wait for a clean 15M candle close beyond the swing, not just a wick
Double Manipulation — What to Do
If you find yourself in a trade where price has swept a second time (double manipulation), it means there was no key level at the first sweep. Do not add to the losing position. Wait for the second sweep — if a key level now aligns, that becomes the entry.
Risk Management for Gold Trading
Gold moves fast. A single news event — Fed statement, geopolitical shock, CPI data — can move XAUUSD $20–$40 in minutes. Position sizing and stop placement must account for this volatility.
The ICT approach places stops above the swept high (plus buffer), which means the stop distance is often $8–$15 per ounce. With a standard lot of 100 oz, a $10 stop = $1,000 risk per lot. For a $10,000 account at 1% risk per trade ($100 risk), this means trading 0.01 lots (micro lot). Adjust lot size accordingly.
Never risk more than 1–2% of account equity on any single gold trade. Gold's volatility makes larger position sizes extremely dangerous — a standard lot move of $30 against you is a $3,000 loss.
✦ Gold Risk Management Parameters
1–2%
Maximum account risk per trade
$3–5
Buffer above swept high for stop loss (in dollars per oz)
1:2 min
Minimum risk-to-reward ratio before entering any trade
Kill Zone
Only trade during London (07–10 UTC) or NY Open (12–15 UTC)
Top-Down
Always confirm daily bias before any H1 or 15M entry
Key Level
No trade without OB, FVG, PDH or PDL at the swept level
Related: Pip Value Calculator
Calculate exact pip value for your gold lot size before trading → Pip Value Calculator · justwolves.in/tools/pip-calculator
Reference: XAUUSD Live Chart and Analysis — TradingView
Recommended charting platform for marking ICT levels on gold → XAUUSD Live Chart and Analysis — TradingView · www.tradingview.com/symbols/XAUUSD/
When the Setup Is Invalid
Not every liquidity sweep on XAUUSD is tradeable. The setup is invalid if price sweeps a key level but the reaction lacks a Fair Value Gap or order block to confirm rejection — a sweep without a confirming imbalance is noise, not a signal.
It is also invalid outside a clear premium or discount zone: a sweep in the middle of the range, with no top-down bias supporting it, has no structural edge behind it.
High-impact news — Fed statements, CPI, geopolitical shocks — can move XAUUSD $20–$40 in minutes and invalidate the setup entirely by blowing through the mapped key levels. If a red-flag event is due within the next hour, skip the trade rather than force an entry into it.
The XAUUSD Filter, Summarized
✦ Gold ICT Strategy — What to Remember
- Gold sweeps liquidity systematically every session — understanding this turns the trap into an entry trigger
- Mark 5 key levels before every session: PDH/PDL, Asian session H/L, H1 swing H/L, H1 FVGs, H1 OBs
- The key level filter is the most important rule: only enter on a sweep if an OB, FVG, PDH or session level aligns at the swept point
- Without key level alignment, expect a second sweep (double manipulation) before the real reversal — wait for it
- Premium zone (above H4 50% midpoint): shorts only. Discount zone (below midpoint): longs only
- Top-down sequence: Daily bias → H4 premium/discount → H1 key levels → 15M sweep confirmation → 1M CISD entry
- Stop loss goes above the swept high (+ $3–5 buffer), not below the OB/FVG entry zone
- Trade only during London Kill Zone (07:00–10:00 UTC) or NY Open Kill Zone (12:00–15:00 UTC) for highest probability
- Minimum 1:2 R:R required before entering — verify with the Risk/Reward Calculator at justwolves.in/tools/risk-reward
- Risk 1–2% of account per trade maximum — gold's volatility makes overleveraging fatal to account health
Frequently Asked Questions
What is the ICT key level filter and why does it matter for gold trading?
The key level filter means you only enter on a liquidity sweep when a higher-timeframe key level (order block, fair value gap, PDH, PDL, or session high/low) aligns at or just beyond the swept level. Without this filter, many sweeps are followed by a second sweep (double manipulation) that stops you out. The key level provides the institutional reason for price to reverse — without it, there is no structural reason for the move to end.
How do I find the premium and discount zones for XAUUSD?
Find the most recent significant swing high and swing low on the H4 chart. Add them together and divide by 2 to get the equilibrium (midpoint). If current gold price is above the midpoint, you are in the premium zone and should only look for short setups. If below the midpoint, you are in the discount zone and should only look for long setups. Our free Market Hours Clock at justwolves.in/tools/market-hours helps you time entries within the correct kill zones.
What is the best time to trade gold using the ICT method?
The London Kill Zone (07:00–10:00 UTC) and the New York Open Kill Zone (12:00–15:00 UTC) are the two highest-probability windows for ICT gold setups. During these windows, institutional participation is highest, sweeps are clean, and reversals are decisive. Avoid trading the middle of the US session (17:00–20:00 UTC) and late Asian session where gold drifts without clear institutional intent.
Where exactly should I place my stop loss on an ICT gold trade?
Place your stop loss above the swept high (for shorts) or below the swept low (for longs). Add a $3–$5 buffer per ounce to account for spread and volatility. The stop goes above the swept extreme, not below your entry POI (FVG or OB). Placing the stop inside the key level region will result in it being triggered during normal price delivery before the move begins.
What is a double manipulation sweep and how do I handle it?
A double manipulation occurs when the market sweeps a swing high or low, you expect a reversal, and then the market sweeps again to a new high or low. This happens when there is no key level at the first swept point — there is no institutional reason to reverse. When you identify a sweep with no key level alignment, do not enter. Wait. The second sweep — which often reaches a PDH, weekly high, or OB — is the actual setup. That second sweep, with the key level now aligned, becomes the high-probability entry.
Can I use this gold ICT strategy with a small account?
Yes. The strategy works with micro lot sizes (0.01 lots). The key is position sizing: risk exactly 1% of your account per trade regardless of lot size. For a $1,000 account (1% risk = $10 per trade), with a typical $10 stop on gold, you would trade 0.01 standard lots. The strategy's edge comes from the quality of setups, not the size of positions. Use our Pip Calculator at justwolves.in/tools/pip-calculator to convert dollar risk to the correct lot size for your account.
Topics