What if you could define your entire trading framework for the day with a single candle — before the first trade is even considered? That is exactly what the 4-hour range breakout strategy does. The first four-hour candle of the day (New York time) establishes a high and a low. Every trade for the rest of the day is either a long or a short based on how price interacts with those two levels. No trend analysis. No complex indicators. Just a three-step checklist that has produced win rates of 60% to 83% across crypto, forex and gold in live backtests.
The Core Idea: One Candle, All Day
Traditional traders spend hours each morning analysing trends, drawing structures, and determining bias. The 4-hour range approach does none of this. Instead, it asks one question: where is the reference range for today?
The answer is the first four-hour candle of the trading day (based on New York time). This candle captures the initial institutional positioning of the session. Its high and low represent the range within which the market decided to trade during the first four hours. When price later breaks outside this range on a smaller timeframe, it is making a directional statement. When that breakout reverses and price comes back inside, it is providing a precise, rule-based entry.
The strategy is trend-agnostic: it does not require knowing whether the broader market is bullish or bearish. It exploits the natural behaviour of price to break out of consolidation zones and then return to test them before continuing.
No Prediction Required
This strategy does not require predicting market direction. You do not need to know whether it is a bull or bear day. The range tells you the framework; the breakout and re-entry tell you the trade. Remove prediction entirely — execute mechanically.
Rule 1: Mark the 4-Hour Range
Open TradingView. Select the asset you want to trade. Set the timeframe to 4 hours. Critically: go to the timezone setting in the bottom-right corner of the chart and select New York time. This is essential — the first 4-hour candle must be based on New York time, not your local timezone.
Identify the first 4-hour candle that formed on the current date. For example, if today is a Monday in New York time, the first 4-hour candle starts at midnight New York time (00:00 ET) and closes at 04:00 ET. Wait for this candle to fully close before marking the range — never mark a candle that is still forming.
Draw a horizontal line at the high of this completed candle. Draw a second horizontal line at the low. Extend both lines to the right edge of the chart. These are your 4-hour range levels for the entire trading day.
Wait for Full Candle Close
Critical: always wait for the first 4-hour candle to FULLY CLOSE before marking the levels. If you mark the high and low while the candle is still forming, the levels will change as the candle continues and your reference will be inaccurate. Patience here is mandatory.
✦ Setting Up the 4-Hour Range
TradingView
Recommended charting platform — free tier is sufficient for this strategy
NY Time Zone
Must select New York time in chart settings — bottom-right corner of TradingView
Fully Closed
Only mark the range when the first 4H candle has fully closed — never on a live candle
Rule 2: Wait for the 5-Minute Breakout
Switch to the 5-minute chart. Now watch price interact with your two range levels. You are looking for a specific event: a 5-minute candle that closes outside the range — either above the range high (bullish breakout) or below the range low (bearish breakdown).
The key rule: wicks do not count. Only a full candle BODY CLOSE outside the range is a valid breakout signal. If the wick extends above the range high but the candle body closes back inside, that is a rejection — not a breakout. Strict adherence to this rule filters out the vast majority of false signals.
A valid breakout is when a 5-minute candle closes clearly above the range high (with the full body outside the range) or clearly below the range low. This is your confirmation that a directional move is underway.
Wicks Do Not Count
Wick rule: if price only spikes above/below the range line but the 5-minute candle body closes back inside, that is NOT a valid breakout. You need the candle to CLOSE (not just touch) outside the range. Wick-only tests are reversals, not breakouts.
Rule 3: Take the 5-Minute Re-Entry
After a valid breakout (5-minute candle closing outside the range), you do not enter immediately. You wait. Specifically, you wait for price to re-enter the range — a 5-minute candle that closes back INSIDE the range after the breakout.
This re-entry is the actual trade trigger. When price breaks above the range high and then closes back below it, the breakout has failed — and that failed breakout is your entry signal in the opposite direction (short). When price breaks below the range low and then closes back above it, the breakdown has failed — and that is your long entry signal.
This counter-move entry has a specific logic: the failed breakout trapped retail traders who entered on the break. Those trapped traders' stop-losses fuel the reversal move inside the range. You are entering on the side of the reversal, with the trapped breakout buyers/sellers providing the momentum.
Important constraint: the breakout and re-entry must happen on the same trading day as the 4-hour range you marked. Do not carry setups from one day to the next.
"The re-entry is more powerful than the breakout. When price returns inside the range after a clear break, trapped traders get stopped out and that order flow drives the reversal. You are entering with the institutional flush, not against it.
Entry, Stop-Loss and Target Rules
Trade Execution Rules
Entry: close of the re-entry candle
For a short setup (price broke above range high and returned inside): enter at the close of the first 5-minute candle that closes back below the range high. For a long setup (price broke below range low and returned inside): enter at the close of the first 5-minute candle that closes back above the range low.
💡 Use a limit order at the projected re-entry candle close level if you can predict it, or a market order at the actual close. Avoid entering mid-candle — wait for the body to confirm.Stop-Loss: exact high/low of the breakout move
For shorts: place stop-loss at the exact highest wick of the breakout candle. For longs: place stop-loss at the exact lowest wick of the breakdown candle. The stop goes at the extreme of the failed breakout — the point that would invalidate the re-entry thesis.
💡 If the breakout candle was unusually large, use the nearest key support or resistance level instead of the breakout extreme. Oversized stops reduce R:R significantly.Take-Profit: 2× the stop-loss distance
Measure from entry to stop-loss. Double that distance. Set your take-profit at 2× the stop distance in the direction of the re-entry. This ensures every winning trade produces twice the gain of every losing trade.
Multiple entries on the same day
If the first setup resolves (either stop or target) and another valid breakout-re-entry sequence forms later in the same day, you can take a second trade. The range levels remain valid for the entire day. Apply the same rules — another valid breakout (body close outside range) followed by re-entry (body close back inside range).
Related: Risk/Reward Calculator
Set your exact stop and target levels before entering any scalp trade → Risk/Reward Calculator · justwolves.in/tools/risk-reward
When the Re-Entry Setup Fails
The re-entry is the trigger, not the breakout itself, which means the setup is invalid more often than it is valid. If price breaks the 4-hour range and keeps trending without ever closing a 5-minute candle back inside the range, there is no re-entry to take — a strong trend day simply does not produce this setup, and chasing the breakout directly abandons the strategy's edge.
It is also invalid if, after re-entering the range, price immediately breaks through the opposite side before a position is opened. That signals the range has failed entirely rather than produced a clean re-entry — the correct response is to stand aside until the next 4-hour range forms.
Why This Approach Works
The 4-hour range represents genuine institutional activity during the first session period. It is not an arbitrary level — it is where the market actually traded for four hours. The high and low of this range are therefore meaningful to institutional algorithms and large players who use the same timeframe references.
When price breaks and returns into this range, two powerful forces converge. First, the trapped breakout traders are being stopped out, providing exit liquidity for the reversal. Second, the range boundary acts as a magnetic support/resistance level — institutions that were active during the 4-hour formation period use it as a reference for new entries.
The 5-minute timeframe filters noise while remaining fast enough to capture intraday moves. The body-close rule for both the breakout and the re-entry ensures you are reacting to confirmed, completed price action — not anticipating moves or reacting to wicks.
Live Results on Crypto (Bitcoin)
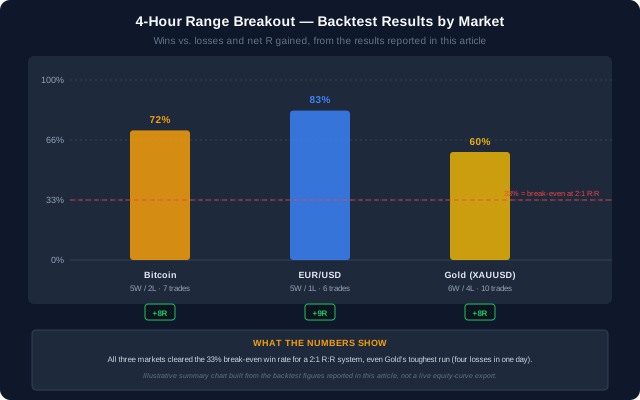
A 7-trade backtest on Bitcoin across several days produced 5 wins and 2 losses — a 72% win rate. Total gain: 8R. Notably, one day produced four valid setups: three long re-entries (all winners at 2R each) and one short re-entry (winner). The fourth setup on the same day came from a failed breakdown followed by a particularly clean re-entry, with a stop placed at the nearest key level rather than the breakout extreme due to the size of the breakdown candle.
The 2 losing trades were straightforward: price re-entered the range as expected, hit the stop-loss, and moved in the original breakout direction. On one of these losing days, a second setup appeared later — another 1R loss. Both losses were contained exactly as planned, demonstrating the risk management working as designed.
✦ Bitcoin Backtest Results
72%
Win rate over 7 backtested trades
8R
Total gain across all 7 trades
5W/2L
Breakdown — 5 winners, 2 losses
Live Results on Forex (EURUSD)
A 6-trade backtest on EURUSD produced 5 wins and 1 loss — an impressive 83% win rate. Total gain: 9R. On the first test day, the range was broken immediately at the open with price closing above the range high, then immediately re-entering, producing a short trade that hit the stop (1R loss). Shortly after, price re-entered a second time from the same breakout — a second short, which reached the 2R target. Then two more valid short re-entries both hit targets.
On the second day, two long setups appeared back-to-back after a clean breakdown and re-entry. Both reached the 2R target. The strategy demonstrated particular consistency on forex due to the inherent mean-reversion tendency of major pairs around key reference levels during London and New York sessions.
✦ EURUSD Backtest Results
83%
Win rate — highest of the three markets tested
9R
Total gain across 6 trades
5W/1L
Breakdown — 5 winners, 1 loss
Live Results on Gold (XAUUSD)
A 10-trade backtest on XAUUSD produced 6 wins and 4 losses — a 60% win rate. Total gain: 8R. Gold was the most volatile of the three markets, producing more frequent breakouts and requiring more use of the "nearest key level" rule for stop placement when breakout candles were unusually large.
Four consecutive losses across a single day were followed by a winning trade when a breakout candle was large enough to require an order block as the stop reference — this reduced the stop distance, improved R:R, and the trade hit its target. The gold results demonstrate that even at 60% win rate, the 2:1 R:R makes the strategy profitable: 6 × 2R = 12R gains minus 4 × 1R = 4R losses = net 8R.
✦ XAUUSD Gold Backtest Results
60%
Win rate — lowest of the three markets but still profitable
8R
Total gain across 10 trades
6W/4L
Breakdown — 6 winners, 4 losses
Related: Live Forex Market Hours Clock
Track London and NY session opens for optimal 4-hour range timing → Live Forex Market Hours Clock · justwolves.in/tools/market-hours
Multiple Setups in a Single Day
One of the advantages of this strategy is that it can produce more than one valid trade per day. After the first setup resolves (stop or target), if another breakout-re-entry sequence forms later in the same day, it qualifies as a second trade using the same 4-hour range levels.
The constraint: all trades must occur within the same trading day as the marked 4-hour range. At the end of the session, the old range is retired. The next day, a new first 4-hour candle forms a new range — a completely fresh framework with no carry-over from the previous day.
Do not force a second trade if the re-entry does not appear clearly. One clean trade per day, executed well, outperforms two mediocre trades every time.
How to Handle Large Breakout Candles
Occasionally, the breakout candle will be significantly larger than usual — caused by a news event, a strong momentum push, or a gap. Placing the stop at the extreme of a very large candle creates a wide stop that produces a small position size and reduces the overall R:R quality.
In these cases, use the nearest key level instead of the breakout extreme. If price breaks above the range high by 50 pips and the breakout candle is huge, look for the nearest resistance level — a swing high, an order block, or a round number — above the range high. Place the stop there instead. This keeps the stop distance reasonable while still protecting against the thesis being invalidated.
The take-profit is still set at 2× the adjusted stop distance from entry. The setup is still valid — only the stop reference changes.
Adjusting for Oversized Breakouts
Large breakout candle rule: if the stop at the breakout extreme would be more than 2× your average stop size for this instrument, use the nearest key level above/below the range boundary instead. Preserve the 2:1 R:R by adjusting stop first, then calculating target.
Position Sizing and Risk Controls
The 4-hour range strategy is designed for scalpers — traders who want to be in and out of positions within the same session. Risk per trade: 1% of total account equity. This ensures that even on a losing day with two losses, only 2% of capital is drawn down.
Position sizing formula: (Account equity × 0.01) ÷ stop distance in quote currency = maximum lot size. Use the Pip Calculator at justwolves.in/tools/pip-calculator to convert stop distance in pips to dollar value for exact sizing.
Never add to a losing position. If the first trade of the day is a loss, the second trade uses the same 1% risk calculation — not an increased size to recover. Scaling up after losses is how traders turn small setbacks into account-ending drawdowns.
✦ Risk Management Parameters
1%
Maximum account risk per trade — absolute rule
2:1
Minimum R:R ratio before entering any position
Same day
All setups must be taken within the same session as the range
Related: Pip Value Calculator
Convert your stop-loss distance to correct lot size for any instrument → Pip Value Calculator · justwolves.in/tools/pip-calculator
Reference: Live TradingView Charts for Range Analysis
Mark and track 4-hour ranges with free TradingView chart tools → Live TradingView Charts for Range Analysis · www.tradingview.com
The 4-Hour Range Checklist
✦ 4-Hour Range Breakout Strategy — Summary
- Mark the high and low of the first 4-hour candle of the day (New York time) — these are your only reference levels
- Always wait for the first 4H candle to fully close before marking — never mark a live, still-forming candle
- Switch to 5-minute chart; wait for a candle BODY CLOSE outside the range — wicks do not count
- After a valid breakout (body close outside range), wait for a re-entry (body close back inside range)
- The re-entry is your entry signal: short after a failed breakout above range high, long after a failed breakdown below range low
- Stop-loss: exact high of the breakout candle (for shorts) / exact low (for longs) — use nearest key level if the candle is oversized
- Take-profit: 2× the stop distance in the direction of the re-entry
- All setups must occur on the same day as the range that was marked — start fresh each day with a new range
- Results: Bitcoin 72% win rate (8R total), EURUSD 83% win rate (9R total), Gold 60% win rate (8R total)
- Risk 1% of account per trade — never add to losing positions or increase size after a loss
Frequently Asked Questions
Which time zone should I use for the first 4-hour candle?
New York time. On TradingView, go to the clock icon in the bottom-right corner and select New York (EST/EDT). The first 4-hour candle of the day begins at midnight New York time (00:00 ET). Wait for this candle to fully close (at 04:00 ET) before marking its high and low.
Can I take a trade if only the wick goes outside the range, not the body?
No. The rules require a candle BODY close outside the range for a valid breakout. A wick that touches or crosses the range boundary but closes back inside is a rejection or a false breakout — not a valid signal. Strictly requiring body closes is what keeps the win rate high by filtering noise.
What happens if there is a large gap at the open that immediately puts price outside the range?
A gap at the open that places price outside the 4-hour range counts as a potential breakout if the first 5-minute candle closes outside the range. Wait for that first candle to close to confirm. Then wait for the re-entry. Treat gaps with the large-breakout adjustment — use the nearest key level for the stop if the gap was unusually large.
Can I combine this strategy with trend filters?
Yes. Adding a simple trend filter — for example, only taking long re-entries when the daily candle is bullish (closing higher than it opened) and short re-entries when bearish — can improve the win rate further. This is described as combining with "other concepts like price action or trends" to "instantly boost performance." Start with the base rules first; add filters only after you have a solid baseline of results.
How long does each trade typically take to reach the target?
Highly variable. Scalp trades from the 4-hour range re-entry can reach the 2R target in minutes on high-momentum days or take 1–3 hours on slower days. Set your take-profit level and stop-loss as hard orders immediately upon entry, then let the market work. Do not time the trade — let the levels do the work.
Topics