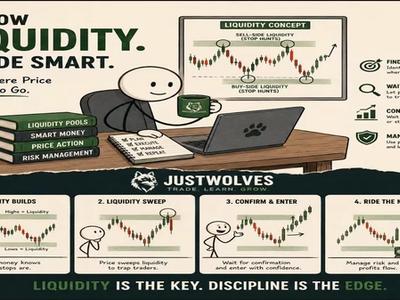
Most traders think scalping is about capturing small movements in large quantities. It is not. True scalping is about trading on a short timeframe and closing positions within minutes to an hour — and capturing moves that are often much larger than the stop-loss risk. This 15-minute liquidity sweep strategy, developed over seven years of live trading, does exactly that: it finds moments when the market takes a swing high or low (sweeping stop-loss clusters), closes back inside without follow-through, and uses the 1-minute chart for a precise, low-risk entry with R:R ratios of 4:1, 5:1 and higher.
The Truth About Scalping Most Traders Miss
Conventional scalping wisdom says: trade small moves, take many trades, accept tiny profits per trade. This approach has a fatal flaw: transaction costs (spread, commission, slippage) consume a disproportionate percentage of each tiny profit. A strategy designed around 5-pip targets gets destroyed by a 2-pip spread.
The liquidity sweep approach inverts this logic. Targets are not small — they extend to the next 15-minute swing level, which can be 20, 40, or even 80 pips away from entry. The stop-loss is tight: placed just below the 1-minute breakout candle or the 15-minute sweep candle, often just 5–10 pips of actual risk. The result is a 4:1 or 5:1 R:R ratio that makes each winner dramatically larger than each loser.
This is why the strategy works with just one trade per day — and why quality of setup selection matters far more than trade frequency.
Quality Over Quantity
This is not a high-frequency strategy. You will often take just one or two trades per session. The edge comes from finding the right moment — the sweep — and entering with precision. A 4:1 trade that wins once makes you the same profit as four 1:1 trades all winning. Focus entirely on quality.
How This Strategy Works: Three Steps
✦ Strategy Overview
Step 1
Mark 15-minute structural swing highs and lows — these are your liquidity targets
Step 2
Wait for price to take the level (wick through it) but close back on the same side — the sweep
Step 3
Switch to 1-minute chart, mark the next candle's opening level, enter on a close beyond it
Rule 1: Mark the 15-Minute Swing Highs and Lows
Open TradingView. Set the timeframe to 15 minutes. You are looking for structural swing highs and lows — price levels where the market has previously turned, showing that buyers or sellers were present there at meaningful volume.
A structural swing high is a 15-minute candle whose high is higher than the highs of the candles on both sides of it — a local peak in price. A structural swing low is a 15-minute candle whose low is lower than the lows of the surrounding candles — a local trough. Mark these levels with horizontal lines.
Focus on the most recent highs and lows that price has not yet revisited since they formed. These unvisited levels are where stop-loss orders cluster: retail traders who sold at the high have buy stops above it; traders who bought at the low have sell stops below it. The presence of these stops makes these levels magnets for institutional price manipulation.
Finding Active Swing Levels
How to identify which levels to mark: scan right from the current price. Find the nearest swing high that price has not yet reached and closed above. Find the nearest swing low that price has not yet reached and closed below. These are your active targets for the session.
What Makes a Valid Swing Level
Not all swing highs and lows are equal. The highest probability setups come from structural levels that are part of the broader market structure — levels that represent meaningful turning points, not minor consolidation noise.
A high-quality swing high: the candles before and after the peak form a clear V-shape or inverted-V, the high stands out visually on the chart, and it was formed during a session with above-average volume. A low-quality level: a minor bump in a sideways chop, a level that has been tested multiple times (each test depletes the stop-loss cluster), or a level with no visible structural significance.
The candle colour is also relevant. For a bearish sweep setup (you are looking to short after a swing high is taken), prefer a swing high where the peak candle is a bullish (green/white) candle — indicating buyers pushed price up to that level aggressively. A bearish peak candle at the high is already a sign of rejection and reduces the remaining stop-loss cluster above it.
Rule 2: Wait for the Liquidity Sweep
Now you watch the market. You are waiting for a specific event: a 15-minute candle that takes the swing high (the wick goes above it) but whose body closes back BELOW the swing high. For swing lows, you want a candle whose wick goes below the level but closes back ABOVE it.
This is the liquidity sweep. The wick above the swing high represents the price being driven up to collect the buy stops sitting above the level (stop-loss orders from retail shorts). The body closing back below the high confirms that the institutional sellers used that liquidity — they sold into the buy stop orders — and price is now reversing.
The sweep typically happens at the high of the previous candle group, but sometimes price needs two or three candles around the level before the sweep completes. The critical confirmation is always the same: the candle BODY must close back on the entry side of the swing level.
"The wick takes the liquidity. The body closing back inside confirms the sweep is complete. Without the body close — without that confirmation — you do not have a sweep, you have a breakout.
Critical Distinction: Sweep vs Breakout
Sweep vs Breakout: A sweep candle takes the level with a wick but the body closes back below (for highs) or above (for lows). A breakout candle closes with its body ABOVE the swing high or BELOW the swing low. Breakouts mean continuation — sweeps mean reversal. These are opposite signals. Do not confuse them.
How to Read a Valid Sweep vs a Breakout
This distinction is the technical core of the strategy. Every sweep attempt looks identical as the price is moving — only the close determines which it is.
A valid sweep (bearish setup): the 15-minute candle wick goes above the swing high. The candle closes back below the swing high. The close can be anywhere below the high — including a bullish candle whose upper wick is the sweep. The body just needs to close below the swept level.
An invalid setup (breakout): the 15-minute candle closes with its full body above the swing high. This is not a sweep — it is a breakout to the upside. The market is likely to continue higher. Do not enter short here.
A subtle case: a bullish candle whose wick goes above the swing high but closes near the high (only slightly below it). This is a weak sweep — the rejection from the level is not strong. Weaker sweeps produce lower-probability reversals. Focus on sweeps where the body closes significantly below the swept level — showing clear rejection.
Rule 3: Trigger the Entry on the 1-Minute
When you identify a valid 15-minute sweep, wait for that sweep candle to close. Note the closing price — this becomes the opening price of the next 15-minute candle. Mark this exact price level with a horizontal line on your chart. This is your trigger level.
Now switch to the 1-minute chart. The next 15-minute candle has just opened. On the 1-minute chart, watch how price behaves around your trigger level. Your entry signal: the first 1-minute candle that closes BELOW your trigger level (for a bearish setup after a sweep of a swing high).
For a bullish setup (sweep of a swing low): the first 1-minute candle that closes ABOVE your trigger level is the entry.
Why this precise entry? Because the opening price of the post-sweep 15-minute candle is the exact moment the institutional reversal begins. A 1-minute close below it on bearish setups means the reversal is confirmed on the lowest meaningful timeframe — maximum precision, minimum stop distance.
The Exact Trigger Level
The trigger level is always the CLOSING PRICE of the sweep candle = OPENING PRICE of the next 15-minute candle. This is a specific, measurable price — not a zone, not an estimate. Mark the exact price. On TradingView, hover over the sweep candle close to get the exact price.
Stop-Loss and Target Placement
Stop-loss options (choose one based on your risk tolerance and setup quality):
Option 1 — Tight stop: below the low of the 1-minute entry candle. This is the minimum stop distance, giving the highest R:R ratio but also the highest chance of being stopped out by micro-volatility.
Option 2 — Standard stop: below the low of the sweep candle on the 15-minute chart. This is the logical invalidation point — if price goes back through the sweep low, the thesis is wrong.
Option 3 — Safe stop: below the low of the entire 15-minute sweep candle including its wick. This gives the most room and survives temporary volatility. Use this for higher R:R setups where the target is far away.
Take-profit: look left on the 15-minute chart for the nearest structural swing level in the direction of your trade. For a short after a swing high sweep, the target is the nearest previous 15-minute swing low that price has not yet visited. This often produces 3:1, 4:1 or 5:1 R:R on clean setups.
✦ Stop-Loss Options by Risk Level
Tight
Below 1-minute entry candle low — tightest stop, highest R:R, most vulnerable to noise
Standard
Below 15-minute sweep candle body low — logical invalidation, balanced R:R
Safe
Below 15-minute sweep candle full wick low — widest stop, survives volatility
When the Sweep Setup Is Invalid
Not every wick through a swing level is a valid sweep. If the candle closes beyond the level instead of snapping back — a clean break rather than a wick-and-reject — the setup is invalid. That is a breakout, not a sweep, and trading it as a sweep means fading real momentum.
It is also invalid if price never returns to the trigger level within a reasonable number of 1-minute candles. A level that price runs away from without retesting was not defended, and there is no clean entry to take.
If the stop-loss would sit beyond the most recent opposing swing high or low, the setup no longer offers a sound risk/reward and should be skipped rather than adjusted after the fact.
High-Probability Levels to Focus On
Not all swing highs and lows offer equal probability. The strategy works on any structural level, but certain categories of levels produce cleaner sweeps and sharper reversals than others. Focusing on these reduces trade frequency but dramatically increases win rate.
The core principle: quality over quantity. Mark fewer levels. Trade only the highest-probability setups. A trader taking 2 trades per week from the top-tier levels will outperform a trader taking 10 trades per week from mixed-quality levels — because the win rate on the best levels is significantly higher.
1. FVG Highs and Lows
When a Fair Value Gap (three-candle imbalance) has its high or low coincide with a structural swing level, the combination is particularly powerful. Price filled part of the FVG and created a swing at the FVG boundary — the remaining unfilled FVG above the swing high acts as an additional magnetic draw, pulling price up to sweep the high into the FVG. The sweep then completes inside the FVG and reverses. This is the highest-probability combination in the strategy.
2. Market Structure Highs and Lows
These are swing points where the overall market structure changes direction. A bearish market structure has a series of lower highs and lower lows — each lower high is a premium sell zone. A bullish market structure has higher highs and higher lows — each higher low is a discount buy zone. When price sweeps one of these structural highs or lows and closes back inside, the market structure is defending itself — a high-probability reversal signal.
Session Highs and Lows as Prime Targets
Session highs and lows — specifically the Asian session high/low, the London session high/low, and the New York session high/low — are the single most reliable liquidity targets in the entire strategy.
The reason: every retail trader with a 15-minute chart can see these levels. Retail buy stops sit just above the London high. Retail sell stops sit just below the Asian low. Institutional players know this. They deliberately drive price into these obvious levels during the subsequent session to collect the stop-loss liquidity before reversing.
Session timing: Asian session (20:00–00:00 ET), London session (02:00–05:00 ET), New York session (07:00–10:00 ET). When New York price takes the London session high during the NY open but cannot close above it — that is the highest-probability bearish sweep setup in the entire strategy. When London price sweeps the Asian session low but closes back above it — that is the highest-probability bullish sweep for the London session.
Related: Live Market Hours Clock with Session Tracker
Track Asian, London and NY session highs and lows in real time → Live Market Hours Clock with Session Tracker · justwolves.in/tools/market-hours
✦ Session Level Priority
NY takes London High
NY open sweeps London session high — highest probability bearish reversal
London takes Asia Low
London open sweeps Asian session low — highest probability bullish reversal
NY takes Asia High/Low
NY session sweeps Asian range extreme — strong reversal when combined with FVG or OB
Structural Levels and FVG Boundaries
Beyond session levels, the next tier of high-probability levels are structural swing highs and lows that coincide with FVG boundaries or order blocks.
A swing high that sits at the top of a bearish FVG is a particularly powerful sell zone. Price fills the FVG, sweeps the swing high into the FVG, and reverses. The FVG provides the "ceiling" that limits further upside — institutional sellers are waiting inside the FVG to distribute positions.
Similarly, a swing low that coincides with the bottom of a bullish FVG (or the top of a bullish order block) creates a strong buy zone. When price sweeps the swing low into the FVG and the 15-minute candle closes back above, the setup combines liquidity collection with institutional order absorption — the most favourable combination available.
Candle Direction Filter
When evaluating a sweep of a swing high, check the colour of the candle that makes the sweep. For a bearish setup (expecting a drop after a swing high sweep), you want the sweep candle to be bearish or to close with significant upper wick rejection.
If the sweep candle is strongly bullish — closes near its high — even if the body is technically below the swing high, the aggressive bullish close suggests buyers are still in control. This reduces the probability of a successful bearish reversal.
The ideal sweep candle profile for a bearish setup: the candle takes the swing high wick, then closes as a bearish (or neutral) candle well below the swept level. The stronger the close below the high, the cleaner the sweep and the higher the probability of the reversal.
Conversely, for a bullish setup (sweep of a swing low): you want the sweep candle to be bullish or to show clear rejection of the lower wick — closing well above the swept low, ideally as a strong bullish candle.
Candle Direction as a Quality Filter
Candle direction rule: after a sweep of a swing high, the sweep candle should NOT be strongly bullish. A bullish close near the swept high means buyers are still dominant — wait for a bearish candle close below the high before treating it as a valid sweep. This single filter can eliminate 30–40% of lower-quality setups.
Trade Examples
Example 1: NY Open Sweeps London High (Bearish Setup)
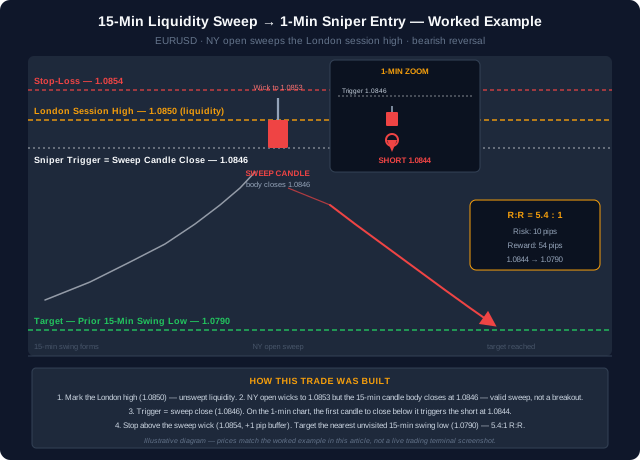
The London session forms a high at 1.0850 on EURUSD. The high is a clean structural swing point — a sharp reversal with a visible upper wick. New York opens (07:00 ET) and price rallies immediately toward 1.0850.
A 15-minute candle wick goes to 1.0853 — taking the London high — but the candle closes at 1.0846. The body is below the London high: valid sweep. The sweep candle is bearish, closing well below the swept level.
Mark the close of the sweep candle (1.0846) as the trigger level. Switch to 1-minute chart. Next candle opens. Within 3 minutes, a 1-minute candle closes at 1.0844 — below the trigger level. Entry at close: 1.0844. Stop: above the 15-minute sweep wick high at 1.0853 + 1 pip buffer = 1.0854. Target: nearest prior 15-minute swing low at 1.0790. R:R = (1.0844−1.0790) ÷ (1.0854−1.0844) = 54 pips ÷ 10 pips = 5.4:1.
Example 2: Asian Low Sweep at London Open (Bullish Setup)
The Asian session forms a low at 1.2100 on GBPUSD. London opens and price sells off sharply toward 1.2100. A 15-minute candle wicks to 1.2094 — below the Asian low — but closes at 1.2103. The body is above the Asian low: valid bullish sweep. The sweep candle is bullish, closing above the level.
Trigger level: 1.2103. Switch to 1-minute. First 1-minute candle closes at 1.2107 — above the trigger. Long entry at 1.2107. Stop: below the 15-minute sweep wick low at 1.2094 − 1 pip buffer = 1.2093. Target: nearest 15-minute swing high at 1.2165. R:R = (1.2165−1.2107) ÷ (1.2107−1.2093) = 58 pips ÷ 14 pips = 4.1:1.
Managing Risk on the Entry
The high R:R ratios this strategy produces (4:1, 5:1) mean the win rate requirements are lower than most strategies. At a 4:1 R:R, you break even with a 20% win rate — meaning you can lose 80% of trades and still not lose money. In practice, well-executed liquidity sweep setups on high-probability levels produce win rates of 50–65%.
Position sizing: risk exactly 1% of account equity per trade. The stop distance varies by trade — wider stop (standard or safe option) means smaller position size; tighter stop means slightly larger position size. The dollar risk is always the same 1% regardless.
Drawdown management: if you experience three consecutive losses, pause for the day. Consecutive losses often indicate a market condition that does not suit the strategy — trending strongly in one direction without meaningful sweep-and-reverse patterns. Wait for the next session.
✦ Risk Management Rules
1% risk
Maximum account equity risk per trade — non-negotiable
4:1+ R:R
Target R:R on quality setups — calculate before entry, not after
3-loss stop
Stop trading for the session after 3 consecutive losses — market not optimal
Related: Pip Value Calculator
Calculate exact position size for your stop-loss distance on any pair → Pip Value Calculator · justwolves.in/tools/pip-calculator
Reference: EURUSD and GBPUSD Live Charts — TradingView
Mark 15-minute swing levels and session highs/lows for sweep setups → EURUSD and GBPUSD Live Charts — TradingView · www.tradingview.com
The Liquidity Sweep Entry Checklist
✦ 15-Minute Liquidity Sweep Entry — Summary
- Mark structural 15-minute swing highs and lows — specifically those price has not yet revisited (unswept levels = intact stop-loss clusters)
- A valid sweep: the candle WICK goes above (or below) the swing level but the candle BODY closes back on the same side — wick through, body back inside
- After the sweep, mark the closing price of the sweep candle as the trigger level — this is the opening price of the next 15-minute candle
- Switch to 1-minute chart; enter when the first 1-minute candle closes BELOW the trigger (for shorts) or ABOVE the trigger (for longs)
- Stop-loss options: below 1-minute entry candle (tight), below 15-min sweep body (standard), below 15-min sweep wick (safe)
- Target: nearest prior 15-minute swing level in the direction of the trade — R:R ratios of 4:1 to 5:1 are typical on quality setups
- Highest-probability levels: session highs/lows (Asian, London, NY), FVG boundary highs/lows, market structure swing points
- Candle direction filter: for bearish setups, avoid sweeps where the sweep candle closes as a strong bullish candle — look for bearish or rejection closes
- Session targets: NY sweeping the London high = best bearish setup; London sweeping the Asian low = best bullish setup
- Risk 1% per trade; stop after 3 consecutive losses; focus on 1–2 trades per session, not trade frequency
Frequently Asked Questions
What is the difference between a liquidity sweep and a breakout?
A liquidity sweep occurs when the candle WICK takes a swing high or low but the candle BODY closes back below (for highs) or above (for lows) the swept level. The body closing back inside confirms the move was driven by stop-loss collection, not genuine direction. A breakout is when the candle BODY closes above the swing high or below the swing low — confirming continuation in the breakout direction. These are opposite signals and must not be confused.
What is the trigger level and how exactly do I calculate it?
The trigger level is the closing price of the 15-minute sweep candle. This is the same price as the opening price of the next 15-minute candle. On TradingView, hover over the closing price of the sweep candle and mark the exact price with a horizontal line. On the 1-minute chart, your entry is the first 1-minute candle that closes on the other side of this exact price in the direction of the expected reversal.
Why focus on session highs and lows specifically?
Session highs and lows are the most-watched levels in the market. Every retail trader marks the London high, the Asian low, the NY session range. The concentration of stop-loss orders at these levels is higher than at any other intraday level. Institutional players deliberately drive price into these clusters to collect liquidity (fill large orders against the retail stops) before reversing. The predictability of this behaviour makes session-level sweeps the highest-probability setups in the strategy.
Do I need to be watching the chart all day to use this strategy?
No. The key sweep windows are session opens: London open (02:00–04:00 ET) for Asian range sweeps, and New York open (07:00–09:00 ET) for London range sweeps. These two 2-hour windows cover the majority of high-probability setups. Outside these windows, sweep setups occur less frequently and have lower probability. Two focused 2-hour sessions per day is sufficient — no need to watch charts all day.
Can this strategy be combined with the ICT concepts?
Yes — this strategy is fundamentally ICT-aligned. The liquidity sweep concept is central to ICT methodology. Combining it with the key level filter (checking for an OB or FVG above the swept swing high) elevates the setup quality further. For comprehensive XAUUSD gold setups, see our Gold ICT Strategy guide which covers the same sweep-and-reverse concept with PDH/PDL and session-level alignment.
Topics