Most traders make scalping complicated. They add five indicators, draw dozens of lines, and spend hours watching charts for a setup that may never come. This strategy removes all of that. Three steps. Two levels. One timeframe switch. And a single pattern — the Fair Value Gap — that tells you exactly when the big players have entered the market. The result: a repeatable setup that produces at least one trade per day in under 90 minutes of screen time, with a proven 64% win rate over a 30-day backtest.
Why This Strategy Works Every Day
The 9:30 AM New York open (14:30 UTC) is the most important 15-minute window in the trading day. More volume flows through the market in the first 30 minutes of the US session than at any other comparable period. The first 5-minute candle captures the opening momentum and the initial range that institutional players use as a reference.
When price breaks out of that initial range, it signals a directional decision. But a breakout alone is not enough — retail traders break out and fail all the time. The Fair Value Gap confirmation tells you that institutional money created the move, not retail chasing. That distinction is the difference between a setup with edge and a random entry.
This strategy has one additional advantage that makes it ideal for beginners: it forces you to stop trading after the setup either works or fails. No overtrading. No revenge trades. The range is the framework for the entire day.
Universal Applicability
This strategy works on any market that trades during or around the 9:30 AM New York session: US futures (ES, NQ, MNQ), equities, forex major pairs, XAUUSD gold, and crypto on US-facing exchanges. The same three steps apply to all of them.
Phase 1: Mark the 9:30 AM Opening Range
Open TradingView and select any instrument you want to trade. Set the chart to the 5-minute timeframe. Identify the 9:30 AM New York candle — the first 5-minute candle of the US session. Wait for this candle to close completely (at 9:35 AM ET).
Draw a horizontal line at the high of this candle. Draw a second horizontal line at the low of this candle. These two lines are the only levels you need for the entire trading day. Everything else on the chart is noise. The opening range high is your bullish breakout level. The opening range low is your bearish breakdown level.
Do not change these lines during the day. They are fixed. Price will interact with them repeatedly — sometimes retesting them from below, sometimes from above — but your job is only to watch for the specific break-in pattern described in Step 3.
How to Draw the Opening Range
TradingView setup: chart → 5-minute → find the 9:30 AM candle. Use TradingView's "Ray" tool to draw horizontal lines at the high and low. Extend both lines to the right edge of the chart. These are your two trading levels for the day.
✦ Opening Range Stats
9:30 AM ET
Exact time to mark the opening range (New York time zone)
5-Min Chart
Timeframe for identifying the range candle
2 Levels
High and low — the only two price references you need for the whole day
Phase 2: Wait for the Break
Switch to the 1-minute chart. Now watch price interact with your two opening range levels. You are waiting for a strong directional break — price closing clearly above the opening range high (bullish setup) or clearly below the opening range low (bearish setup).
The key word is strong. A single candle closing marginally above the high with no momentum is not enough. You want to see a decisive push — a candle that closes well beyond the level with momentum. This tells you that buyers (for a bullish break) or sellers (for a bearish break) have stepped in aggressively, not tentatively.
If the break is weak — a wick over the level with a candle closing back near it — do not act. Wait. The real break will be obvious when it happens: a full candle body closing outside the range with visible momentum. This directional conviction is the raw ingredient that makes the next step — the FVG break-in — valid.
Body Close, Not a Wick
The break must be a CLOSE, not just a wick. If only the wick goes above the high but the candle body closes back below it, that is a rejection — not a valid break. You need a candle body closing above the high (for longs) or below the low (for shorts).
What Is a Fair Value Gap (FVG)?
A Fair Value Gap is a three-candle pattern that forms during strong institutional moves. When the market moves so fast that not all orders can be filled at every price level, it leaves a gap — an area where no two-sided trading occurred. This imbalance is the FVG.
To identify an FVG: look at three consecutive candles. If the high of candle 1 (the first candle) is lower than the low of candle 3 (the third candle), there is a bullish FVG in the gap between them. If the low of candle 1 is higher than the high of candle 3, there is a bearish FVG.
The middle candle (candle 2) is the engine — the strong move that created the displacement. The gap between candle 1's high and candle 3's low (for bullish FVGs) is the zone where price is likely to return, because institutional algorithms seek to pair unfilled orders in that area.
For this scalping strategy, you are looking for a bullish FVG that forms above the opening range high after a break, or a bearish FVG that forms below the opening range low after a break.
The Institutional Signal
Why does the FVG confirm institutional participation? Because creating a three-candle imbalance above the opening range requires large order flow. Retail traders do not create FVGs — institutions do, when they need to fill significant positions quickly. The FVG is your signal that the smart money has entered.
Reference: Fair Value Gap Explained — BabyPips
Comprehensive guide to identifying and trading Fair Value Gaps → Fair Value Gap Explained — BabyPips · www.babypips.com/learn/forex/fair-value-gaps
Phase 3: Confirm the Break-In Entry
The break-in is the specific entry trigger. After a strong break above the opening range high, watch the 1-minute chart for a Fair Value Gap to form. You do not enter when the FVG forms — you wait for price to return (pull back) into the FVG zone and react. This pull-back into the institutional imbalance is what gives you a precise low-risk entry with a tight stop.
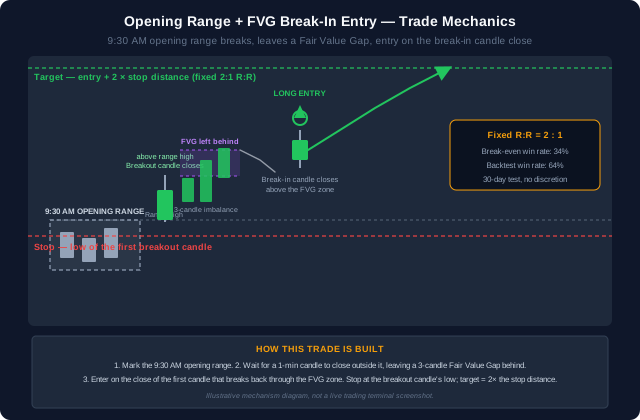
For a bullish setup (break above opening range high): wait for a 1-minute FVG to form above the opening range high, then wait for price to pull back into the FVG zone. Your entry is when the third candle of a reversal sequence closes above the FVG zone midpoint.
For a bearish setup (break below opening range low): wait for a 1-minute bearish FVG to form below the opening range low, then wait for price to pull back into the FVG zone from below. Your entry is when the third candle closes below the FVG zone midpoint.
The timing matters: this entire sequence — break → FVG formation → break-in entry — typically plays out within the same 5-minute session candle. If the price has moved significantly away from the opening range before the FVG forms, the setup quality is reduced.
"The break-in is not about catching the first move. It is about entering after the institutional imbalance (FVG) has been created, when price returns to fill it — giving you confirmation, a defined entry, and a tight stop.
Entry, Stop-Loss and Target Rules
The rules are fixed and non-negotiable. Changing them between trades is the fastest way to destroy the strategy's edge.
Trade Execution Rules
Entry: Close of the third FVG candle
For a bullish setup: enter at the close of the first 1-minute candle that closes above the FVG zone (the "break-in" candle). For a bearish setup: enter at the close of the first 1-minute candle that closes below the bearish FVG zone. Do not anticipate — wait for the candle close.
💡 On TradingView: use the "Long Position" tool (L key) or "Short Position" tool to visualise the trade before entering.Stop-Loss: Low of the first breakout candle
Place your stop-loss at the low of the first 1-minute candle that broke and closed outside the opening range. For a bullish setup: stop goes below the low of the first candle that closed above the range high. For a bearish setup: stop above the high of the first candle that closed below the range low.
💡 Give the stop a small buffer — 0.5 to 1 pip in forex, or $0.05 in equity — to account for spread and micro-volatility.Take-Profit: 2× the stop-loss distance (2:1 R:R)
Measure the distance from your entry to your stop-loss. Multiply by 2. That is your take-profit level. Fix this before you enter. A 2:1 R:R means every winning trade makes back twice what a losing trade costs — allowing you to be profitable with just a 34% win rate.
💡 Use the Risk/Reward Calculator at justwolves.in/tools/risk-reward to set precise levels without mental maths during fast-moving markets.Once in the trade: do nothing
The trade manages itself. Price will either hit the take-profit or the stop-loss. Do not move the stop. Do not exit early because price is "moving too slowly." Do not extend the take-profit because you feel greedy. The system's edge lives in the rules — deviating from them destroys the edge.
Related: Risk/Reward Calculator
Calculate your exact entry, stop-loss and take-profit levels instantly → Risk/Reward Calculator · justwolves.in/tools/risk-reward
When to Skip the Trade
This setup depends on two specific conditions forming in order, and either one failing invalidates the trade. If price breaks the opening range but no Fair Value Gap forms on the break, there is no institutional imbalance to trade — do not substitute a different entry trigger.
If a Fair Value Gap does form but price never pulls back into it, the entry never arrives. Chasing price after it has moved away from the FVG zone abandons the strategy's fixed risk/reward.
The setup is also invalid on days when the opening range is abnormally wide — around scheduled news releases, for example — since a wide range distorts the 2:1 stop-to-target math the strategy depends on.
Works on Every Market
The opening range concept applies to any instrument that has a defined session start. The 9:30 AM New York time is specifically relevant to US-domiciled instruments — but the principle translates universally.
✦ Markets Where This Strategy Works
US Futures
ES, NQ, MNQ, RTY — 9:30 AM ET first 5-min candle. Highest volume period of the futures day.
Forex
EURUSD, GBPUSD, USDJPY — use 9:30 AM ET or the London open (08:00 GMT) as the range candle.
Gold (XAU)
XAUUSD — extremely reactive to the NY open. 9:30 AM range captures the NY manipulation setup.
US Equities
Any NYSE/NASDAQ stock with sufficient volume. First 5-min candle is the standard opening range.
Options
Use the underlying's opening range direction to choose call (bullish) or put (bearish) ATM options.
Crypto
BTC, ETH on US exchanges — 9:30 AM ET is a real volume event even in crypto markets.
Non-US Session Adaptation
For forex traders in Asia or Europe: substitute the London open (08:00 GMT) for the 9:30 AM ET rule. Draw the first 5-minute candle of the London session. The same FVG break-in logic applies. For Asian session traders, use the Tokyo open (00:00 GMT).
Related: Live Forex Market Hours Clock
Track session opens in real time — know exactly when to mark your range candle → Live Forex Market Hours Clock · justwolves.in/tools/market-hours
Full Month Backtest Results
The strategy was backtested over 30 consecutive trading days using a single contract (or standard lot equivalent). The rules were applied mechanically — no discretionary overrides, no skipped setups.
✦ 30-Day Backtest Summary
17
Total trades taken over 30 trading days
64%
Win rate — 11 winners out of 17 trades
$8,180
Net profit using 1 contract (MNQ equivalent)
2:1
Fixed risk-to-reward ratio on every single trade
$2,700
Single-trade profit on the largest winning day
11 min
Time to target on the largest winning day
A 64% win rate with a 2:1 R:R ratio is a powerful mathematical combination. Even if the win rate dropped to 50% — losing half of all trades — the strategy would remain profitable because winning trades earn twice what losing trades cost. The break-even win rate for a 2:1 R:R system is 33.4% — meaning you need to win only 1 in 3 trades to avoid losing money.
The $8,180 profit figure is on a single contract. Traders scaling to 2 or 3 contracts with appropriate risk management would see proportional gains — and losses. Always size positions based on fixed percentage risk, not fixed contract count.
"With a 2:1 risk-reward ratio, you only need to be right 34% of the time to break even. At 64% accuracy, the mathematics of profitability are working heavily in your favour.
How to Execute the Trade Step by Step
Complete Trade Execution — Day-by-Day Process
Before 9:25 AM ET: prepare your chart
Open TradingView. Go to 5-minute chart on your chosen instrument. Clear any lines from the previous day. Set an alert for 9:30 AM ET if you are not watching the screen.
💡 Pre-market preparation takes less than 2 minutes. The less you do before 9:30, the better — don't try to predict which direction to take before the range is formed.At 9:35 AM ET: draw the range
The 9:30 AM candle has now closed. Draw horizontal lines at its exact high and exact low. These are your two levels for the day. You can now switch to the 1-minute chart.
Watch for the break
On the 1-minute chart, watch price. Wait for a candle to close convincingly above the range high (bullish) or below the range low (bearish). This may happen in the first few minutes or it may take 20–30 minutes. If a strong break does not occur by 10:30 AM ET, the setup quality drops — consider skipping that day.
💡 A sideways chop around the range levels without a clean break is a signal to skip. Not every day will produce a valid setup. That is acceptable — capital preservation on no-signal days is part of the strategy.Identify the FVG
After the break, watch for a Fair Value Gap to form in the direction of the break. Look at the last three 1-minute candles — is there a gap between candle 1's extreme and candle 3's extreme? If yes, mark the FVG zone.
Enter on the break-in candle
Wait for price to pull back into the FVG zone. When the first 1-minute candle closes back above the FVG midpoint (for longs) or below it (for shorts), that is your entry. Set your stop and target immediately upon entry.
Manage the trade hands-off
Once the stop and target are set, step away from the screen. Let the market work. Check back when an alert fires for either the stop or target level. Your session is done for the day.
Risk Management and Position Sizing
The strategy's fixed 2:1 R:R handles the reward side automatically. What you control is position size — how much you risk per trade. The rule: never risk more than 1% of your account per trade.
For a $10,000 account: maximum risk per trade is $100. Measure the distance from your entry to your stop-loss in dollars (or pips). Divide your maximum dollar risk ($100) by the stop distance to get your maximum position size. This keeps any single losing trade from materially damaging your account.
Over a 30-day period with 17 trades at 1% risk per trade, even a complete losing run of 6 consecutive losses (which is statistically unlikely at 64% win rate but possible) costs only 6% of capital — easily recoverable. This is how professional scalpers stay in the game for years.
How to Scale Responsibly
Scaling this strategy: once you have 30 winning days with 1 contract at 1% risk, consider adding a second contract — still capped at 1% total risk per trade. Growth comes from consistency first, scaling second. Never scale up after a losing day.
Common Mistakes to Avoid
✦ Mistakes That Kill This Strategy's Edge
- Entering on the BREAK instead of the BREAK-IN — buying the breakout without waiting for the FVG pull-back produces a worse average entry price and wider effective stop
- Moving the stop-loss after entry — the stop is placed at the first breakout candle's low/high for a reason: that is the point that invalidates the setup
- Trading choppy opens — if the opening range candle is very large (>2× average) or the first 30 minutes produce no clear break, skip the day
- Taking trades after 11:00 AM ET — the setup is an opening range strategy; opening-hour setups that form at 12:00 or 14:00 ET do not have the same institutional backing
- Switching instruments mid-session — if EURUSD did not produce a setup, do not then try GBPUSD at 11:00 AM. Stick to one predetermined instrument each day
- Ignoring the 2:1 target — exiting early at 1:1 cuts the mathematical edge in half. Let the target run or use a hard alert
Quick-Reference Recap
✦ 1-Minute Opening Range + FVG Scalping — Summary
- Mark the 9:30 AM ET first 5-minute candle high and low — these are the only two price levels you need all day
- Switch to 1-minute chart and wait for a strong candle CLOSE (not wick) above the high or below the low
- Look for a Fair Value Gap (3-candle imbalance) forming in the direction of the break — this confirms institutional participation
- Enter on the break-in: when price pulls back into the FVG and the first 1-min candle closes back above (or below) the FVG midpoint
- Stop-loss: low of the first breakout candle (for longs) / high of the first breakout candle (for shorts)
- Target: exactly 2× the stop-loss distance — never move it, never exit early
- Strategy works on futures, forex, gold, equities, options and crypto — any market with a defined session open
- 30-day backtest: 17 trades, 64% win rate, $8,180 profit on 1 contract — edge is mathematical and repeatable
- Risk 1% of account per trade maximum — consistent position sizing protects the account during losing runs
- This strategy requires less than 90 minutes of screen time per day — prepare, mark, watch for setup, enter, walk away
Frequently Asked Questions
What exactly is a Fair Value Gap and how do I spot it on a 1-minute chart?
A Fair Value Gap (FVG) is a three-candle imbalance. On the 1-minute chart, look at three consecutive candles after a breakout above the opening range high. If the high of the first candle is lower than the low of the third candle, there is a bullish FVG between them. The gap between the first candle's high and the third candle's low is the FVG zone. For bearish setups, the first candle's low must be higher than the third candle's high.
What time zone should I use for the 9:30 AM rule?
New York Eastern Time (ET). During US daylight saving (March to November), this is UTC−4 (13:30 UTC). During standard time (November to March), it is UTC−5 (14:30 UTC). Use the Market Hours Clock at justwolves.in/tools/market-hours to see the current NY open time in your local timezone.
Can I use this strategy outside of US market hours?
Yes, with a timeframe adaptation. For London session: use the 08:00 GMT first 5-minute candle as your opening range. For Tokyo session: use the 00:00 GMT (midnight) first 5-minute candle. The FVG break-in logic is identical — only the range candle reference time changes.
What should I do if there is no clean FVG after the break?
Skip the trade. Not every breakout produces a valid FVG. A breakout without an FVG is a less-confirmed setup — the institutional imbalance signal is absent, so the edge is reduced. Wait for the next opportunity. It is better to miss a potentially good trade than to enter a lower-probability one without confirmation.
How many trades does this strategy produce per day?
Typically one to two. The opening range usually breaks in one direction first — that is your first setup. If that trade resolves (hits stop or target) and price then breaks the opposite level of the opening range later in the morning with a new FVG, that can be a second trade. Do not force a second trade if the setup is not clean. Quality over quantity.
Is this strategy suitable for complete beginners?
Yes — it is specifically designed for beginners. There are no indicators to configure, no complex tools, and no discretionary pattern reading. Three steps, two levels, one pattern. The discipline required — waiting for the FVG confirmation, not moving the stop, letting the target run — is the hard part, not the analysis. Focus on following the rules exactly for 30 consecutive trades before making any adjustments.
Topics